European vs Apache Cognitive Disability
COMPARE
European
Apache
Cognitive Disability
Cognitive Disability Comparison
Europeans
Apache
17.0%
COGNITIVE DISABILITY
93.4/ 100
METRIC RATING
126th/ 347
METRIC RANK
18.6%
COGNITIVE DISABILITY
0.0/ 100
METRIC RATING
320th/ 347
METRIC RANK
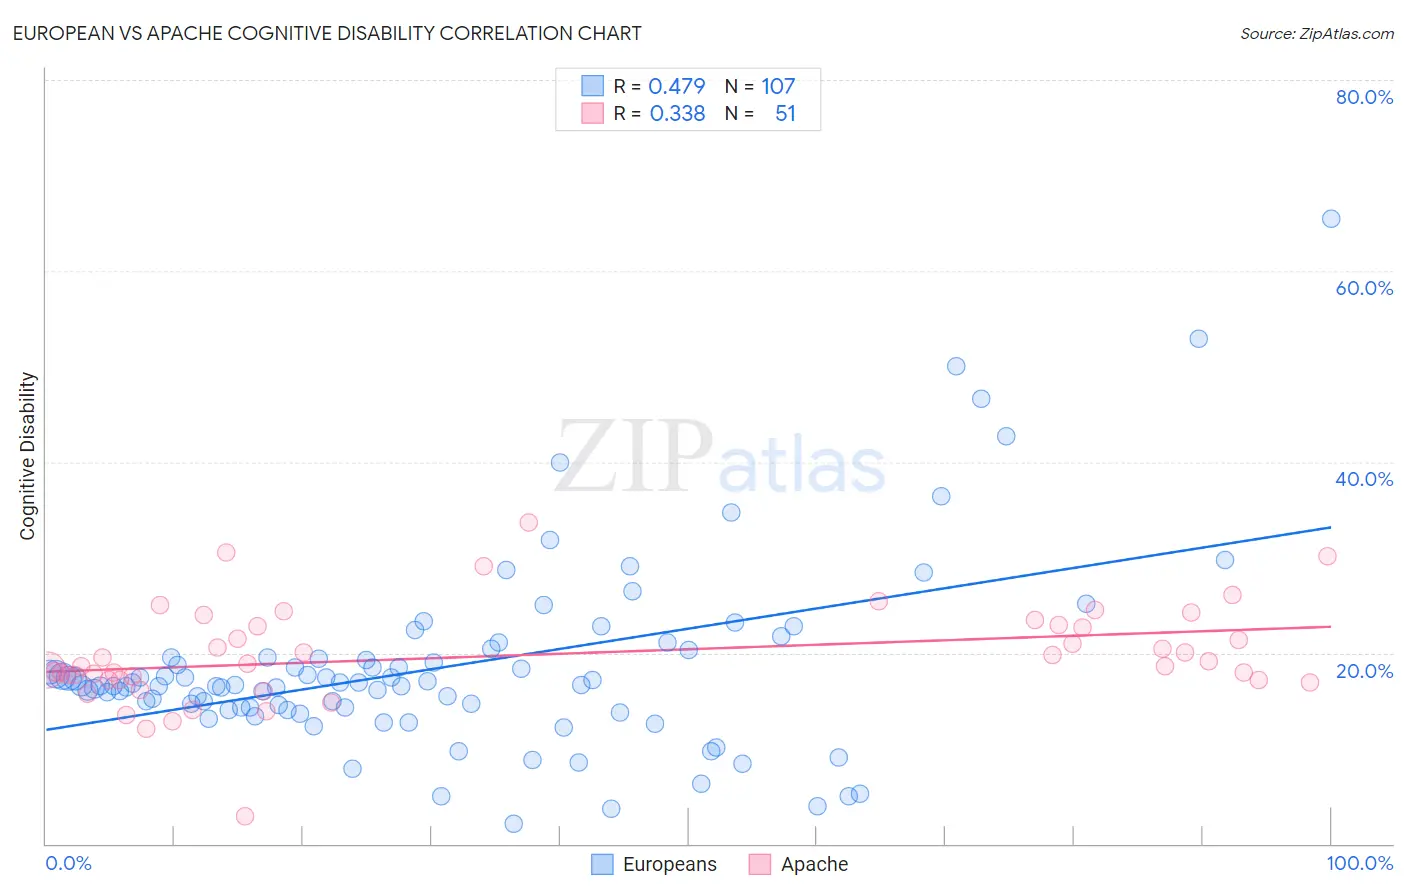
European vs Apache Cognitive Disability Correlation Chart
The statistical analysis conducted on geographies consisting of 561,683,346 people shows a moderate positive correlation between the proportion of Europeans and percentage of population with cognitive disability in the United States with a correlation coefficient (R) of 0.479 and weighted average of 17.0%. Similarly, the statistical analysis conducted on geographies consisting of 231,073,406 people shows a mild positive correlation between the proportion of Apache and percentage of population with cognitive disability in the United States with a correlation coefficient (R) of 0.338 and weighted average of 18.6%, a difference of 9.9%.
Cognitive Disability Correlation Summary
| Measurement | European | Apache |
| Minimum | 2.1% | 2.9% |
| Maximum | 65.5% | 33.7% |
| Range | 63.4% | 30.8% |
| Mean | 18.5% | 19.8% |
| Median | 16.6% | 18.8% |
| Interquartile 25% (IQ1) | 14.2% | 17.2% |
| Interquartile 75% (IQ3) | 19.6% | 23.0% |
| Interquartile Range (IQR) | 5.3% | 5.8% |
| Standard Deviation (Sample) | 9.9% | 5.2% |
| Standard Deviation (Population) | 9.9% | 5.2% |
Similar Demographics by Cognitive Disability
Demographics Similar to Europeans by Cognitive Disability
In terms of cognitive disability, the demographic groups most similar to Europeans are Immigrants from Costa Rica (17.0%, a difference of 0.040%), Nicaraguan (17.0%, a difference of 0.050%), Immigrants from Uruguay (17.0%, a difference of 0.060%), Scandinavian (16.9%, a difference of 0.090%), and Immigrants from Vietnam (17.0%, a difference of 0.12%).
| Demographics | Rating | Rank | Cognitive Disability |
| South Africans | 95.5 /100 | #119 | Exceptional 16.9% |
| Scottish | 95.0 /100 | #120 | Exceptional 16.9% |
| Immigrants | China | 94.9 /100 | #121 | Exceptional 16.9% |
| Immigrants | Western Europe | 94.8 /100 | #122 | Exceptional 16.9% |
| Portuguese | 94.7 /100 | #123 | Exceptional 16.9% |
| Turks | 94.5 /100 | #124 | Exceptional 16.9% |
| Scandinavians | 94.1 /100 | #125 | Exceptional 16.9% |
| Europeans | 93.4 /100 | #126 | Exceptional 17.0% |
| Immigrants | Costa Rica | 93.1 /100 | #127 | Exceptional 17.0% |
| Nicaraguans | 93.0 /100 | #128 | Exceptional 17.0% |
| Immigrants | Uruguay | 92.9 /100 | #129 | Exceptional 17.0% |
| Immigrants | Vietnam | 92.4 /100 | #130 | Exceptional 17.0% |
| Immigrants | Germany | 92.1 /100 | #131 | Exceptional 17.0% |
| Whites/Caucasians | 92.1 /100 | #132 | Exceptional 17.0% |
| Immigrants | Jordan | 91.9 /100 | #133 | Exceptional 17.0% |
Demographics Similar to Apache by Cognitive Disability
In terms of cognitive disability, the demographic groups most similar to Apache are Comanche (18.6%, a difference of 0.040%), Bangladeshi (18.6%, a difference of 0.080%), African (18.6%, a difference of 0.090%), Immigrants from Liberia (18.7%, a difference of 0.16%), and Pueblo (18.7%, a difference of 0.17%).
| Demographics | Rating | Rank | Cognitive Disability |
| Yaqui | 0.0 /100 | #313 | Tragic 18.5% |
| Sub-Saharan Africans | 0.0 /100 | #314 | Tragic 18.5% |
| Immigrants | Dominica | 0.0 /100 | #315 | Tragic 18.6% |
| Immigrants | Middle Africa | 0.0 /100 | #316 | Tragic 18.6% |
| Liberians | 0.0 /100 | #317 | Tragic 18.6% |
| Bangladeshis | 0.0 /100 | #318 | Tragic 18.6% |
| Comanche | 0.0 /100 | #319 | Tragic 18.6% |
| Apache | 0.0 /100 | #320 | Tragic 18.6% |
| Africans | 0.0 /100 | #321 | Tragic 18.6% |
| Immigrants | Liberia | 0.0 /100 | #322 | Tragic 18.7% |
| Pueblo | 0.0 /100 | #323 | Tragic 18.7% |
| Dominicans | 0.0 /100 | #324 | Tragic 18.7% |
| Indonesians | 0.0 /100 | #325 | Tragic 18.7% |
| Immigrants | Senegal | 0.0 /100 | #326 | Tragic 18.7% |
| U.S. Virgin Islanders | 0.0 /100 | #327 | Tragic 18.7% |