European vs British West Indian Cognitive Disability
COMPARE
European
British West Indian
Cognitive Disability
Cognitive Disability Comparison
Europeans
British West Indians
17.0%
COGNITIVE DISABILITY
93.4/ 100
METRIC RATING
126th/ 347
METRIC RANK
18.2%
COGNITIVE DISABILITY
0.1/ 100
METRIC RATING
294th/ 347
METRIC RANK
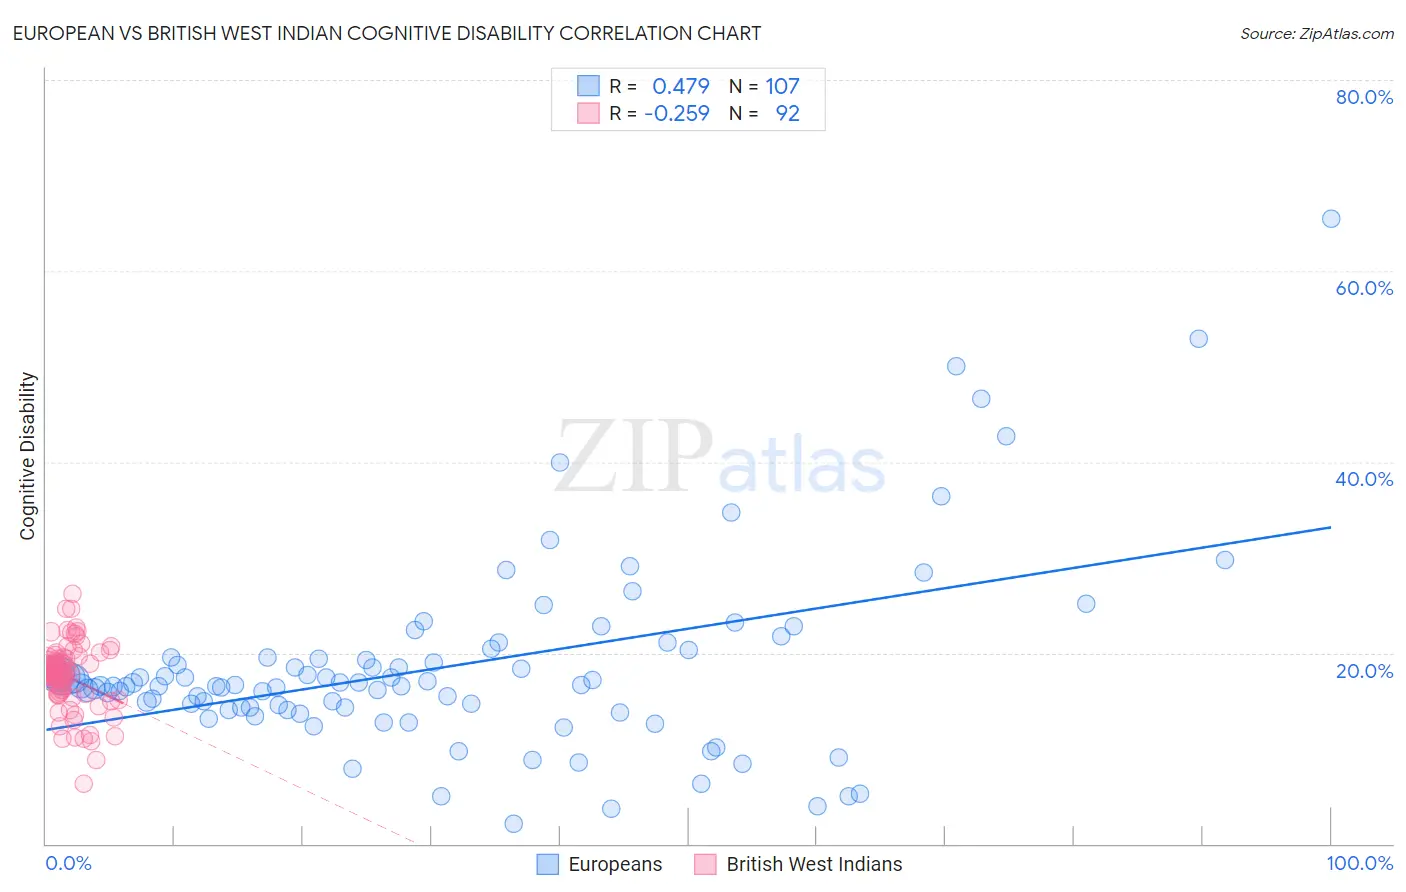
European vs British West Indian Cognitive Disability Correlation Chart
The statistical analysis conducted on geographies consisting of 561,683,346 people shows a moderate positive correlation between the proportion of Europeans and percentage of population with cognitive disability in the United States with a correlation coefficient (R) of 0.479 and weighted average of 17.0%. Similarly, the statistical analysis conducted on geographies consisting of 152,692,524 people shows a weak negative correlation between the proportion of British West Indians and percentage of population with cognitive disability in the United States with a correlation coefficient (R) of -0.259 and weighted average of 18.2%, a difference of 7.4%.
Cognitive Disability Correlation Summary
| Measurement | European | British West Indian |
| Minimum | 2.1% | 6.3% |
| Maximum | 65.5% | 26.1% |
| Range | 63.4% | 19.8% |
| Mean | 18.5% | 17.5% |
| Median | 16.6% | 18.0% |
| Interquartile 25% (IQ1) | 14.2% | 16.0% |
| Interquartile 75% (IQ3) | 19.6% | 19.1% |
| Interquartile Range (IQR) | 5.3% | 3.2% |
| Standard Deviation (Sample) | 9.9% | 3.4% |
| Standard Deviation (Population) | 9.9% | 3.4% |
Similar Demographics by Cognitive Disability
Demographics Similar to Europeans by Cognitive Disability
In terms of cognitive disability, the demographic groups most similar to Europeans are Immigrants from Costa Rica (17.0%, a difference of 0.040%), Nicaraguan (17.0%, a difference of 0.050%), Immigrants from Uruguay (17.0%, a difference of 0.060%), Scandinavian (16.9%, a difference of 0.090%), and Immigrants from Vietnam (17.0%, a difference of 0.12%).
| Demographics | Rating | Rank | Cognitive Disability |
| South Africans | 95.5 /100 | #119 | Exceptional 16.9% |
| Scottish | 95.0 /100 | #120 | Exceptional 16.9% |
| Immigrants | China | 94.9 /100 | #121 | Exceptional 16.9% |
| Immigrants | Western Europe | 94.8 /100 | #122 | Exceptional 16.9% |
| Portuguese | 94.7 /100 | #123 | Exceptional 16.9% |
| Turks | 94.5 /100 | #124 | Exceptional 16.9% |
| Scandinavians | 94.1 /100 | #125 | Exceptional 16.9% |
| Europeans | 93.4 /100 | #126 | Exceptional 17.0% |
| Immigrants | Costa Rica | 93.1 /100 | #127 | Exceptional 17.0% |
| Nicaraguans | 93.0 /100 | #128 | Exceptional 17.0% |
| Immigrants | Uruguay | 92.9 /100 | #129 | Exceptional 17.0% |
| Immigrants | Vietnam | 92.4 /100 | #130 | Exceptional 17.0% |
| Immigrants | Germany | 92.1 /100 | #131 | Exceptional 17.0% |
| Whites/Caucasians | 92.1 /100 | #132 | Exceptional 17.0% |
| Immigrants | Jordan | 91.9 /100 | #133 | Exceptional 17.0% |
Demographics Similar to British West Indians by Cognitive Disability
In terms of cognitive disability, the demographic groups most similar to British West Indians are Central American Indian (18.2%, a difference of 0.070%), Iroquois (18.2%, a difference of 0.080%), Ottawa (18.2%, a difference of 0.15%), German Russian (18.2%, a difference of 0.17%), and Immigrants from Burma/Myanmar (18.2%, a difference of 0.20%).
| Demographics | Rating | Rank | Cognitive Disability |
| Dutch West Indians | 0.1 /100 | #287 | Tragic 18.1% |
| Immigrants | West Indies | 0.1 /100 | #288 | Tragic 18.1% |
| Natives/Alaskans | 0.1 /100 | #289 | Tragic 18.1% |
| Immigrants | Africa | 0.1 /100 | #290 | Tragic 18.1% |
| Ottawa | 0.1 /100 | #291 | Tragic 18.2% |
| Iroquois | 0.1 /100 | #292 | Tragic 18.2% |
| Central American Indians | 0.1 /100 | #293 | Tragic 18.2% |
| British West Indians | 0.1 /100 | #294 | Tragic 18.2% |
| German Russians | 0.0 /100 | #295 | Tragic 18.2% |
| Immigrants | Burma/Myanmar | 0.0 /100 | #296 | Tragic 18.2% |
| Blackfeet | 0.0 /100 | #297 | Tragic 18.3% |
| Japanese | 0.0 /100 | #298 | Tragic 18.3% |
| Ghanaians | 0.0 /100 | #299 | Tragic 18.3% |
| Creek | 0.0 /100 | #300 | Tragic 18.3% |
| Immigrants | Ghana | 0.0 /100 | #301 | Tragic 18.3% |