European vs Immigrants from Fiji Cognitive Disability
COMPARE
European
Immigrants from Fiji
Cognitive Disability
Cognitive Disability Comparison
Europeans
Immigrants from Fiji
17.0%
COGNITIVE DISABILITY
93.4/ 100
METRIC RATING
126th/ 347
METRIC RANK
17.4%
COGNITIVE DISABILITY
33.7/ 100
METRIC RATING
187th/ 347
METRIC RANK
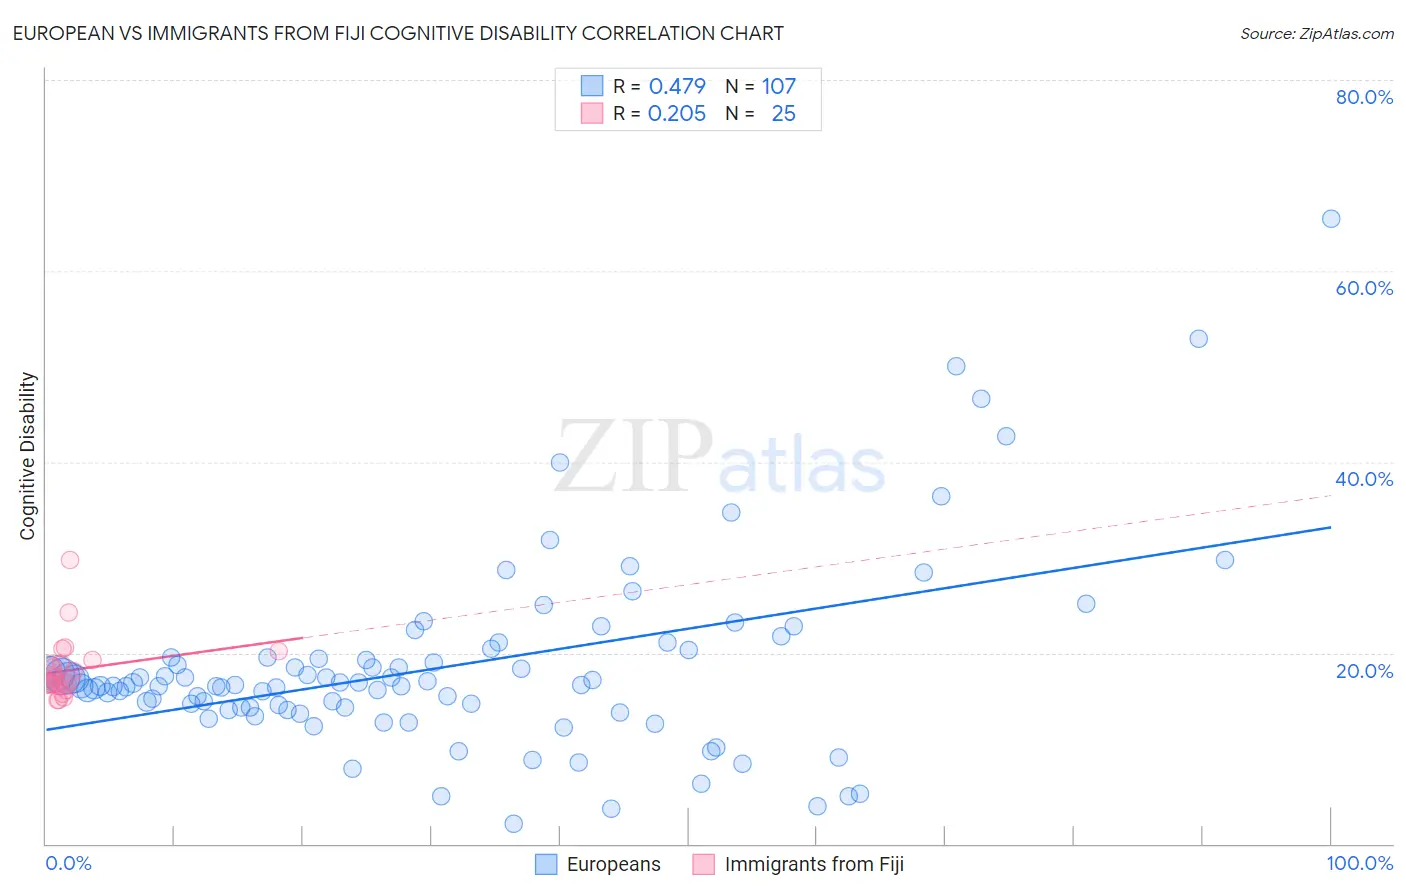
European vs Immigrants from Fiji Cognitive Disability Correlation Chart
The statistical analysis conducted on geographies consisting of 561,683,346 people shows a moderate positive correlation between the proportion of Europeans and percentage of population with cognitive disability in the United States with a correlation coefficient (R) of 0.479 and weighted average of 17.0%. Similarly, the statistical analysis conducted on geographies consisting of 93,755,380 people shows a weak positive correlation between the proportion of Immigrants from Fiji and percentage of population with cognitive disability in the United States with a correlation coefficient (R) of 0.205 and weighted average of 17.4%, a difference of 2.4%.
Cognitive Disability Correlation Summary
| Measurement | European | Immigrants from Fiji |
| Minimum | 2.1% | 15.0% |
| Maximum | 65.5% | 29.7% |
| Range | 63.4% | 14.7% |
| Mean | 18.5% | 18.2% |
| Median | 16.6% | 17.1% |
| Interquartile 25% (IQ1) | 14.2% | 16.6% |
| Interquartile 75% (IQ3) | 19.6% | 19.0% |
| Interquartile Range (IQR) | 5.3% | 2.4% |
| Standard Deviation (Sample) | 9.9% | 3.2% |
| Standard Deviation (Population) | 9.9% | 3.1% |
Similar Demographics by Cognitive Disability
Demographics Similar to Europeans by Cognitive Disability
In terms of cognitive disability, the demographic groups most similar to Europeans are Immigrants from Costa Rica (17.0%, a difference of 0.040%), Nicaraguan (17.0%, a difference of 0.050%), Immigrants from Uruguay (17.0%, a difference of 0.060%), Scandinavian (16.9%, a difference of 0.090%), and Immigrants from Vietnam (17.0%, a difference of 0.12%).
| Demographics | Rating | Rank | Cognitive Disability |
| South Africans | 95.5 /100 | #119 | Exceptional 16.9% |
| Scottish | 95.0 /100 | #120 | Exceptional 16.9% |
| Immigrants | China | 94.9 /100 | #121 | Exceptional 16.9% |
| Immigrants | Western Europe | 94.8 /100 | #122 | Exceptional 16.9% |
| Portuguese | 94.7 /100 | #123 | Exceptional 16.9% |
| Turks | 94.5 /100 | #124 | Exceptional 16.9% |
| Scandinavians | 94.1 /100 | #125 | Exceptional 16.9% |
| Europeans | 93.4 /100 | #126 | Exceptional 17.0% |
| Immigrants | Costa Rica | 93.1 /100 | #127 | Exceptional 17.0% |
| Nicaraguans | 93.0 /100 | #128 | Exceptional 17.0% |
| Immigrants | Uruguay | 92.9 /100 | #129 | Exceptional 17.0% |
| Immigrants | Vietnam | 92.4 /100 | #130 | Exceptional 17.0% |
| Immigrants | Germany | 92.1 /100 | #131 | Exceptional 17.0% |
| Whites/Caucasians | 92.1 /100 | #132 | Exceptional 17.0% |
| Immigrants | Jordan | 91.9 /100 | #133 | Exceptional 17.0% |
Demographics Similar to Immigrants from Fiji by Cognitive Disability
In terms of cognitive disability, the demographic groups most similar to Immigrants from Fiji are Cambodian (17.3%, a difference of 0.070%), Immigrants from France (17.4%, a difference of 0.13%), Afghan (17.3%, a difference of 0.14%), Immigrants from Western Asia (17.4%, a difference of 0.14%), and Crow (17.3%, a difference of 0.17%).
| Demographics | Rating | Rank | Cognitive Disability |
| Pakistanis | 43.9 /100 | #180 | Average 17.3% |
| Immigrants | Guyana | 42.9 /100 | #181 | Average 17.3% |
| Arabs | 42.8 /100 | #182 | Average 17.3% |
| Spaniards | 40.3 /100 | #183 | Average 17.3% |
| Crow | 39.1 /100 | #184 | Fair 17.3% |
| Afghans | 38.2 /100 | #185 | Fair 17.3% |
| Cambodians | 35.9 /100 | #186 | Fair 17.3% |
| Immigrants | Fiji | 33.7 /100 | #187 | Fair 17.4% |
| Immigrants | France | 29.8 /100 | #188 | Fair 17.4% |
| Immigrants | Western Asia | 29.5 /100 | #189 | Fair 17.4% |
| Immigrants | Spain | 27.7 /100 | #190 | Fair 17.4% |
| Immigrants | Nonimmigrants | 27.4 /100 | #191 | Fair 17.4% |
| Immigrants | Haiti | 27.1 /100 | #192 | Fair 17.4% |
| Delaware | 25.6 /100 | #193 | Fair 17.4% |
| Immigrants | Bosnia and Herzegovina | 22.0 /100 | #194 | Fair 17.4% |