European vs Immigrants from Sri Lanka Cognitive Disability
COMPARE
European
Immigrants from Sri Lanka
Cognitive Disability
Cognitive Disability Comparison
Europeans
Immigrants from Sri Lanka
17.0%
COGNITIVE DISABILITY
93.4/ 100
METRIC RATING
126th/ 347
METRIC RANK
16.8%
COGNITIVE DISABILITY
97.1/ 100
METRIC RATING
113th/ 347
METRIC RANK
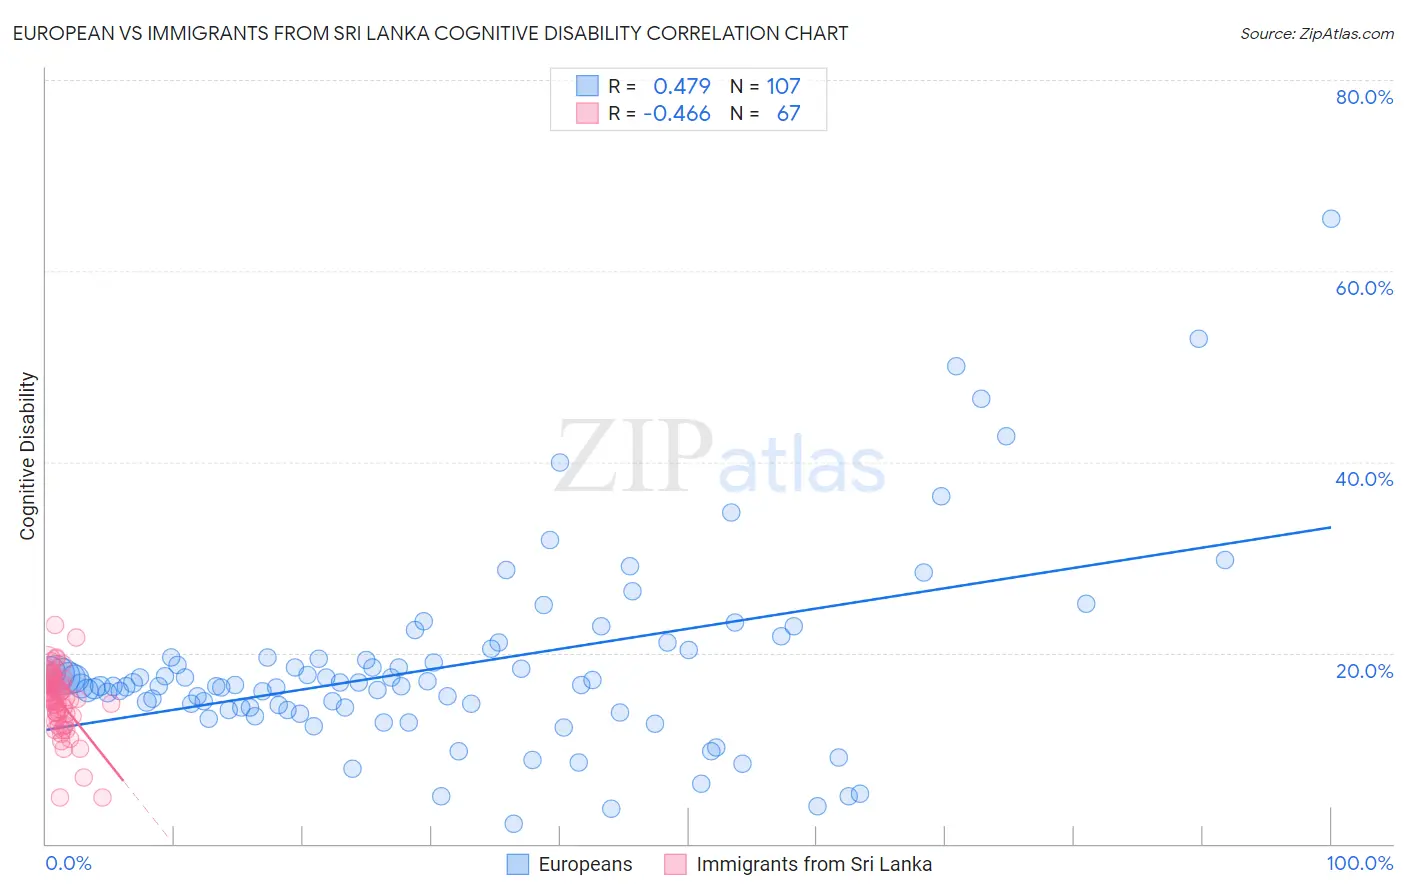
European vs Immigrants from Sri Lanka Cognitive Disability Correlation Chart
The statistical analysis conducted on geographies consisting of 561,683,346 people shows a moderate positive correlation between the proportion of Europeans and percentage of population with cognitive disability in the United States with a correlation coefficient (R) of 0.479 and weighted average of 17.0%. Similarly, the statistical analysis conducted on geographies consisting of 149,697,032 people shows a moderate negative correlation between the proportion of Immigrants from Sri Lanka and percentage of population with cognitive disability in the United States with a correlation coefficient (R) of -0.466 and weighted average of 16.8%, a difference of 0.63%.
Cognitive Disability Correlation Summary
| Measurement | European | Immigrants from Sri Lanka |
| Minimum | 2.1% | 4.8% |
| Maximum | 65.5% | 22.9% |
| Range | 63.4% | 18.1% |
| Mean | 18.5% | 15.0% |
| Median | 16.6% | 15.3% |
| Interquartile 25% (IQ1) | 14.2% | 13.4% |
| Interquartile 75% (IQ3) | 19.6% | 17.0% |
| Interquartile Range (IQR) | 5.3% | 3.6% |
| Standard Deviation (Sample) | 9.9% | 3.3% |
| Standard Deviation (Population) | 9.9% | 3.3% |
Demographics Similar to Europeans and Immigrants from Sri Lanka by Cognitive Disability
In terms of cognitive disability, the demographic groups most similar to Europeans are Immigrants from Costa Rica (17.0%, a difference of 0.040%), Nicaraguan (17.0%, a difference of 0.050%), Immigrants from Uruguay (17.0%, a difference of 0.060%), Scandinavian (16.9%, a difference of 0.090%), and Turkish (16.9%, a difference of 0.14%). Similarly, the demographic groups most similar to Immigrants from Sri Lanka are Indian (Asian) (16.8%, a difference of 0.0%), Korean (16.8%, a difference of 0.0%), Uruguayan (16.8%, a difference of 0.030%), Arapaho (16.8%, a difference of 0.040%), and Albanian (16.8%, a difference of 0.050%).
| Demographics | Rating | Rank | Cognitive Disability |
| Albanians | 97.3 /100 | #109 | Exceptional 16.8% |
| Arapaho | 97.3 /100 | #110 | Exceptional 16.8% |
| Uruguayans | 97.2 /100 | #111 | Exceptional 16.8% |
| Indians (Asian) | 97.2 /100 | #112 | Exceptional 16.8% |
| Immigrants | Sri Lanka | 97.1 /100 | #113 | Exceptional 16.8% |
| Koreans | 97.1 /100 | #114 | Exceptional 16.8% |
| Yup'ik | 96.9 /100 | #115 | Exceptional 16.9% |
| Inupiat | 96.5 /100 | #116 | Exceptional 16.9% |
| Immigrants | Japan | 96.2 /100 | #117 | Exceptional 16.9% |
| Immigrants | Denmark | 96.2 /100 | #118 | Exceptional 16.9% |
| South Africans | 95.5 /100 | #119 | Exceptional 16.9% |
| Scottish | 95.0 /100 | #120 | Exceptional 16.9% |
| Immigrants | China | 94.9 /100 | #121 | Exceptional 16.9% |
| Immigrants | Western Europe | 94.8 /100 | #122 | Exceptional 16.9% |
| Portuguese | 94.7 /100 | #123 | Exceptional 16.9% |
| Turks | 94.5 /100 | #124 | Exceptional 16.9% |
| Scandinavians | 94.1 /100 | #125 | Exceptional 16.9% |
| Europeans | 93.4 /100 | #126 | Exceptional 17.0% |
| Immigrants | Costa Rica | 93.1 /100 | #127 | Exceptional 17.0% |
| Nicaraguans | 93.0 /100 | #128 | Exceptional 17.0% |
| Immigrants | Uruguay | 92.9 /100 | #129 | Exceptional 17.0% |