Ethiopian vs Assyrian/Chaldean/Syriac Self-Care Disability
COMPARE
Ethiopian
Assyrian/Chaldean/Syriac
Self-Care Disability
Self-Care Disability Comparison
Ethiopians
Assyrians/Chaldeans/Syriacs
2.2%
SELF-CARE DISABILITY
100.0/ 100
METRIC RATING
13th/ 347
METRIC RANK
2.8%
SELF-CARE DISABILITY
0.0/ 100
METRIC RATING
318th/ 347
METRIC RANK
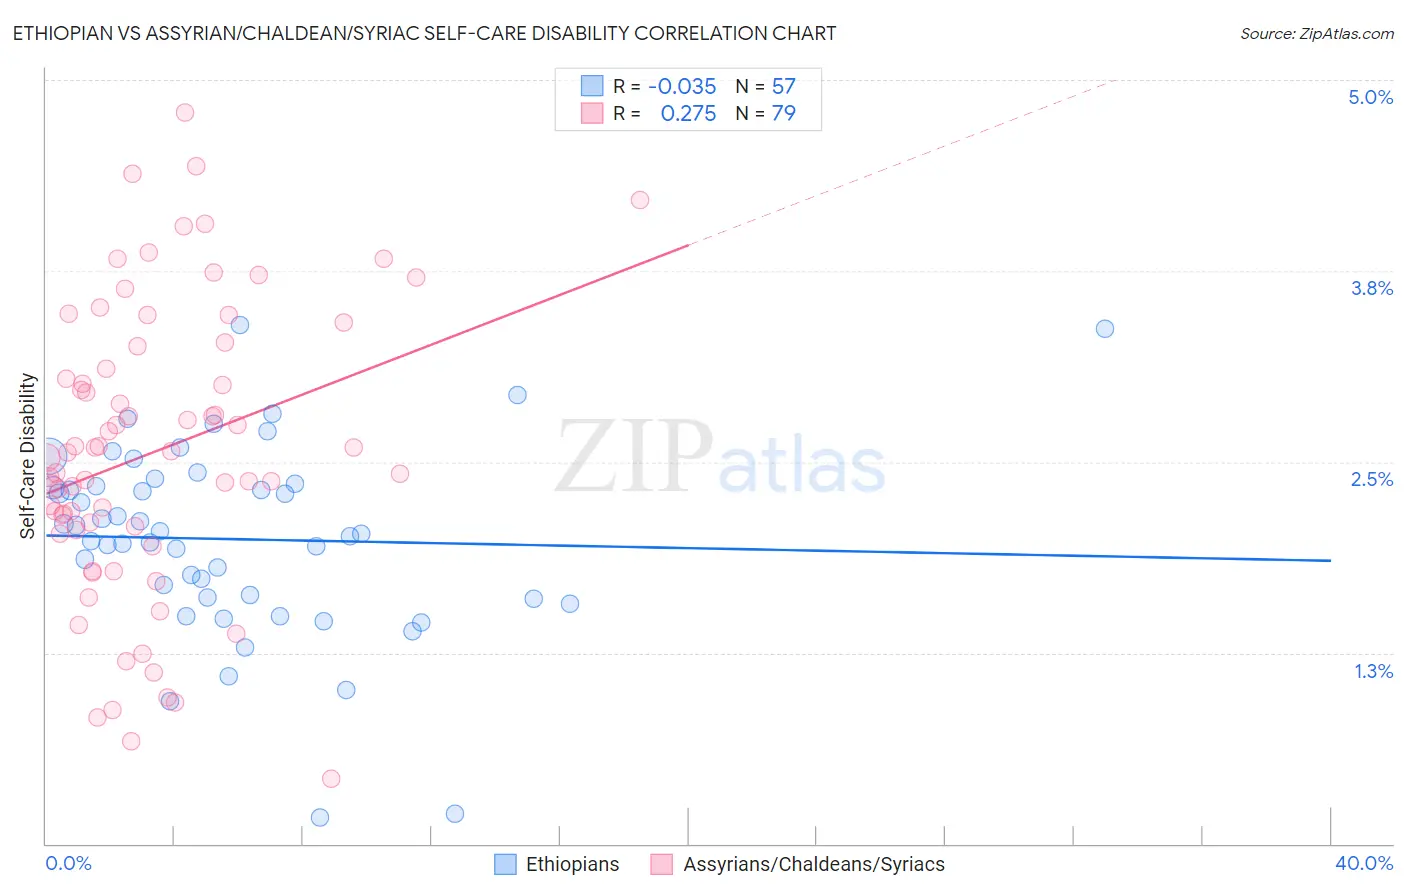
Ethiopian vs Assyrian/Chaldean/Syriac Self-Care Disability Correlation Chart
The statistical analysis conducted on geographies consisting of 223,073,982 people shows no correlation between the proportion of Ethiopians and percentage of population with self-care disability in the United States with a correlation coefficient (R) of -0.035 and weighted average of 2.2%. Similarly, the statistical analysis conducted on geographies consisting of 110,250,746 people shows a weak positive correlation between the proportion of Assyrians/Chaldeans/Syriacs and percentage of population with self-care disability in the United States with a correlation coefficient (R) of 0.275 and weighted average of 2.8%, a difference of 29.8%.
Self-Care Disability Correlation Summary
| Measurement | Ethiopian | Assyrian/Chaldean/Syriac |
| Minimum | 0.17% | 0.43% |
| Maximum | 3.4% | 4.8% |
| Range | 3.2% | 4.4% |
| Mean | 2.0% | 2.6% |
| Median | 2.0% | 2.6% |
| Interquartile 25% (IQ1) | 1.6% | 2.1% |
| Interquartile 75% (IQ3) | 2.3% | 3.3% |
| Interquartile Range (IQR) | 0.74% | 1.2% |
| Standard Deviation (Sample) | 0.63% | 0.95% |
| Standard Deviation (Population) | 0.63% | 0.94% |
Similar Demographics by Self-Care Disability
Demographics Similar to Ethiopians by Self-Care Disability
In terms of self-care disability, the demographic groups most similar to Ethiopians are Immigrants from Ethiopia (2.2%, a difference of 0.010%), Immigrants from South Central Asia (2.2%, a difference of 0.070%), Luxembourger (2.2%, a difference of 0.16%), Sudanese (2.2%, a difference of 0.17%), and Okinawan (2.2%, a difference of 0.17%).
| Demographics | Rating | Rank | Self-Care Disability |
| Filipinos | 100.0 /100 | #6 | Exceptional 2.2% |
| Immigrants | Bolivia | 100.0 /100 | #7 | Exceptional 2.2% |
| Bolivians | 100.0 /100 | #8 | Exceptional 2.2% |
| Immigrants | Nepal | 100.0 /100 | #9 | Exceptional 2.2% |
| Sudanese | 100.0 /100 | #10 | Exceptional 2.2% |
| Immigrants | South Central Asia | 100.0 /100 | #11 | Exceptional 2.2% |
| Immigrants | Ethiopia | 100.0 /100 | #12 | Exceptional 2.2% |
| Ethiopians | 100.0 /100 | #13 | Exceptional 2.2% |
| Luxembourgers | 100.0 /100 | #14 | Exceptional 2.2% |
| Okinawans | 100.0 /100 | #15 | Exceptional 2.2% |
| Immigrants | Kuwait | 100.0 /100 | #16 | Exceptional 2.2% |
| Immigrants | Saudi Arabia | 100.0 /100 | #17 | Exceptional 2.2% |
| Immigrants | Taiwan | 100.0 /100 | #18 | Exceptional 2.2% |
| Immigrants | Eritrea | 100.0 /100 | #19 | Exceptional 2.2% |
| Tongans | 100.0 /100 | #20 | Exceptional 2.2% |
Demographics Similar to Assyrians/Chaldeans/Syriacs by Self-Care Disability
In terms of self-care disability, the demographic groups most similar to Assyrians/Chaldeans/Syriacs are Immigrants from Dominica (2.8%, a difference of 0.010%), Menominee (2.8%, a difference of 0.14%), Spanish American Indian (2.9%, a difference of 0.16%), Immigrants from Cuba (2.8%, a difference of 0.24%), and Chickasaw (2.9%, a difference of 0.37%).
| Demographics | Rating | Rank | Self-Care Disability |
| Puget Sound Salish | 0.0 /100 | #311 | Tragic 2.8% |
| Immigrants | Caribbean | 0.0 /100 | #312 | Tragic 2.8% |
| Spanish Americans | 0.0 /100 | #313 | Tragic 2.8% |
| Creek | 0.0 /100 | #314 | Tragic 2.8% |
| Immigrants | Cuba | 0.0 /100 | #315 | Tragic 2.8% |
| Menominee | 0.0 /100 | #316 | Tragic 2.8% |
| Immigrants | Dominica | 0.0 /100 | #317 | Tragic 2.8% |
| Assyrians/Chaldeans/Syriacs | 0.0 /100 | #318 | Tragic 2.8% |
| Spanish American Indians | 0.0 /100 | #319 | Tragic 2.9% |
| Chickasaw | 0.0 /100 | #320 | Tragic 2.9% |
| Navajo | 0.0 /100 | #321 | Tragic 2.9% |
| Comanche | 0.0 /100 | #322 | Tragic 2.9% |
| Seminole | 0.0 /100 | #323 | Tragic 2.9% |
| Cherokee | 0.0 /100 | #324 | Tragic 2.9% |
| Immigrants | Uzbekistan | 0.0 /100 | #325 | Tragic 2.9% |