English vs Austrian Poverty
COMPARE
English
Austrian
Poverty
Poverty Comparison
English
Austrians
11.3%
POVERTY
96.3/ 100
METRIC RATING
84th/ 347
METRIC RANK
11.2%
POVERTY
97.8/ 100
METRIC RATING
62nd/ 347
METRIC RANK
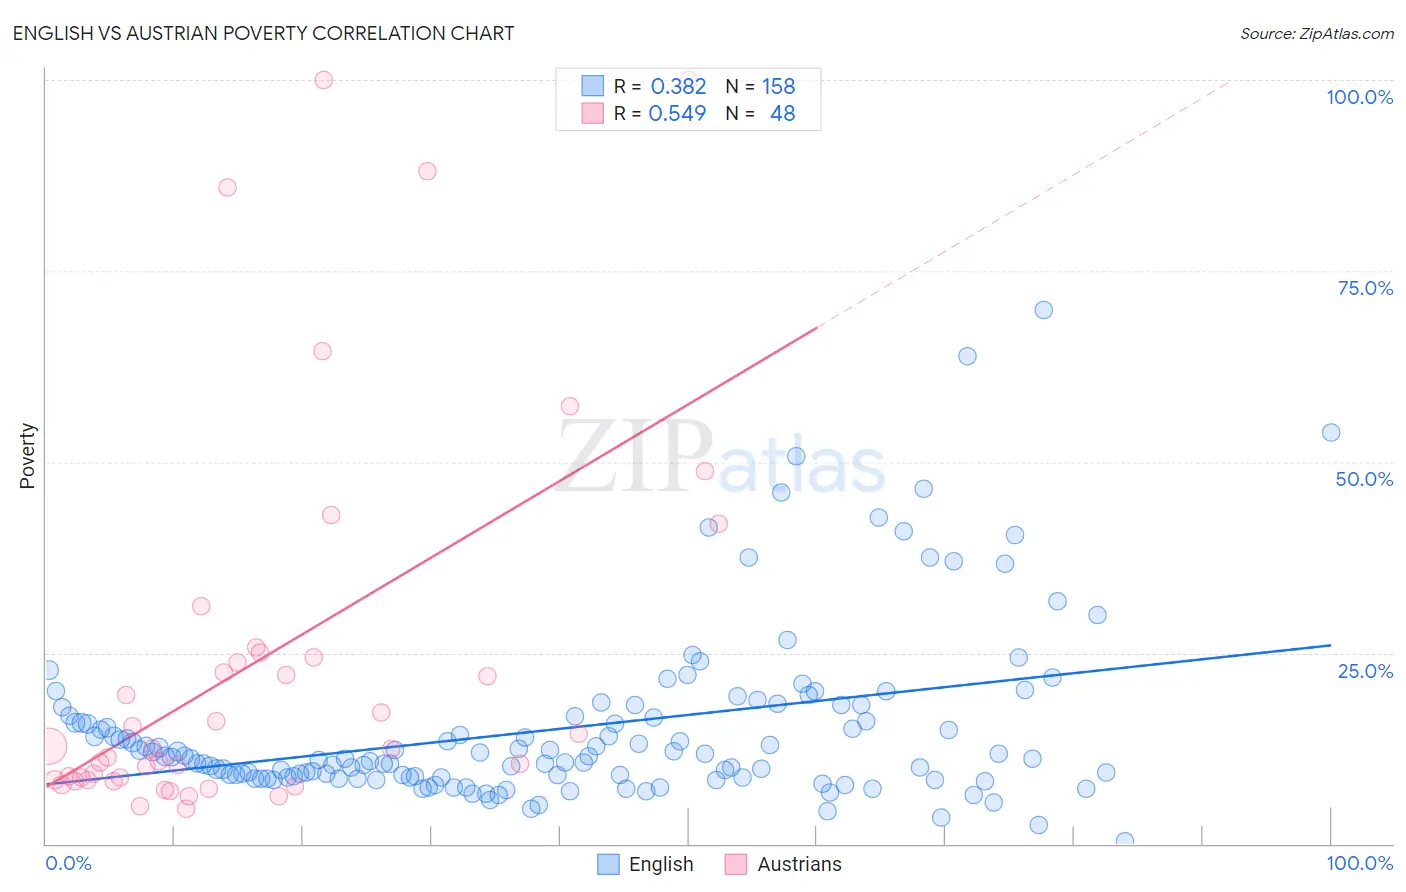
English vs Austrian Poverty Correlation Chart
The statistical analysis conducted on geographies consisting of 578,762,394 people shows a mild positive correlation between the proportion of English and poverty level in the United States with a correlation coefficient (R) of 0.382 and weighted average of 11.3%. Similarly, the statistical analysis conducted on geographies consisting of 451,775,249 people shows a substantial positive correlation between the proportion of Austrians and poverty level in the United States with a correlation coefficient (R) of 0.549 and weighted average of 11.2%, a difference of 1.5%.
Poverty Correlation Summary
| Measurement | English | Austrian |
| Minimum | 0.27% | 4.6% |
| Maximum | 69.9% | 100.0% |
| Range | 69.6% | 95.4% |
| Mean | 15.1% | 23.7% |
| Median | 11.3% | 12.5% |
| Interquartile 25% (IQ1) | 8.7% | 8.4% |
| Interquartile 75% (IQ3) | 16.7% | 24.7% |
| Interquartile Range (IQR) | 8.0% | 16.3% |
| Standard Deviation (Sample) | 11.3% | 25.3% |
| Standard Deviation (Population) | 11.3% | 25.0% |
Similar Demographics by Poverty
Demographics Similar to English by Poverty
In terms of poverty, the demographic groups most similar to English are Immigrants from Sweden (11.3%, a difference of 0.010%), Immigrants from England (11.4%, a difference of 0.070%), Jordanian (11.4%, a difference of 0.18%), Egyptian (11.3%, a difference of 0.19%), and Northern European (11.4%, a difference of 0.19%).
| Demographics | Rating | Rank | Poverty |
| Immigrants | Eastern Asia | 96.7 /100 | #77 | Exceptional 11.3% |
| Dutch | 96.7 /100 | #78 | Exceptional 11.3% |
| Cambodians | 96.7 /100 | #79 | Exceptional 11.3% |
| Indians (Asian) | 96.6 /100 | #80 | Exceptional 11.3% |
| Irish | 96.6 /100 | #81 | Exceptional 11.3% |
| Egyptians | 96.5 /100 | #82 | Exceptional 11.3% |
| Immigrants | Sweden | 96.3 /100 | #83 | Exceptional 11.3% |
| English | 96.3 /100 | #84 | Exceptional 11.3% |
| Immigrants | England | 96.2 /100 | #85 | Exceptional 11.4% |
| Jordanians | 96.0 /100 | #86 | Exceptional 11.4% |
| Northern Europeans | 96.0 /100 | #87 | Exceptional 11.4% |
| Belgians | 95.8 /100 | #88 | Exceptional 11.4% |
| Czechoslovakians | 95.7 /100 | #89 | Exceptional 11.4% |
| Immigrants | Denmark | 95.5 /100 | #90 | Exceptional 11.4% |
| Finns | 95.2 /100 | #91 | Exceptional 11.4% |
Demographics Similar to Austrians by Poverty
In terms of poverty, the demographic groups most similar to Austrians are Ukrainian (11.2%, a difference of 0.0%), Immigrants from Italy (11.2%, a difference of 0.030%), Immigrants from Sri Lanka (11.2%, a difference of 0.10%), Swiss (11.2%, a difference of 0.22%), and Immigrants from Europe (11.2%, a difference of 0.26%).
| Demographics | Rating | Rank | Poverty |
| Immigrants | Serbia | 98.5 /100 | #55 | Exceptional 11.1% |
| Estonians | 98.2 /100 | #56 | Exceptional 11.1% |
| Scandinavians | 98.2 /100 | #57 | Exceptional 11.1% |
| Germans | 98.1 /100 | #58 | Exceptional 11.1% |
| Immigrants | Europe | 98.0 /100 | #59 | Exceptional 11.2% |
| Immigrants | Sri Lanka | 97.9 /100 | #60 | Exceptional 11.2% |
| Immigrants | Italy | 97.9 /100 | #61 | Exceptional 11.2% |
| Austrians | 97.8 /100 | #62 | Exceptional 11.2% |
| Ukrainians | 97.8 /100 | #63 | Exceptional 11.2% |
| Swiss | 97.7 /100 | #64 | Exceptional 11.2% |
| Immigrants | Asia | 97.5 /100 | #65 | Exceptional 11.2% |
| Immigrants | Netherlands | 97.5 /100 | #66 | Exceptional 11.2% |
| Immigrants | Australia | 97.4 /100 | #67 | Exceptional 11.2% |
| Slovaks | 97.4 /100 | #68 | Exceptional 11.2% |
| Serbians | 97.4 /100 | #69 | Exceptional 11.2% |