English vs Austrian Child Poverty Under the Age of 16
COMPARE
English
Austrian
Child Poverty Under the Age of 16
Child Poverty Under the Age of 16 Comparison
English
Austrians
14.9%
CHILD POVERTY UNDER THE AGE OF 16
93.5/ 100
METRIC RATING
110th/ 347
METRIC RANK
14.5%
CHILD POVERTY UNDER THE AGE OF 16
96.9/ 100
METRIC RATING
90th/ 347
METRIC RANK
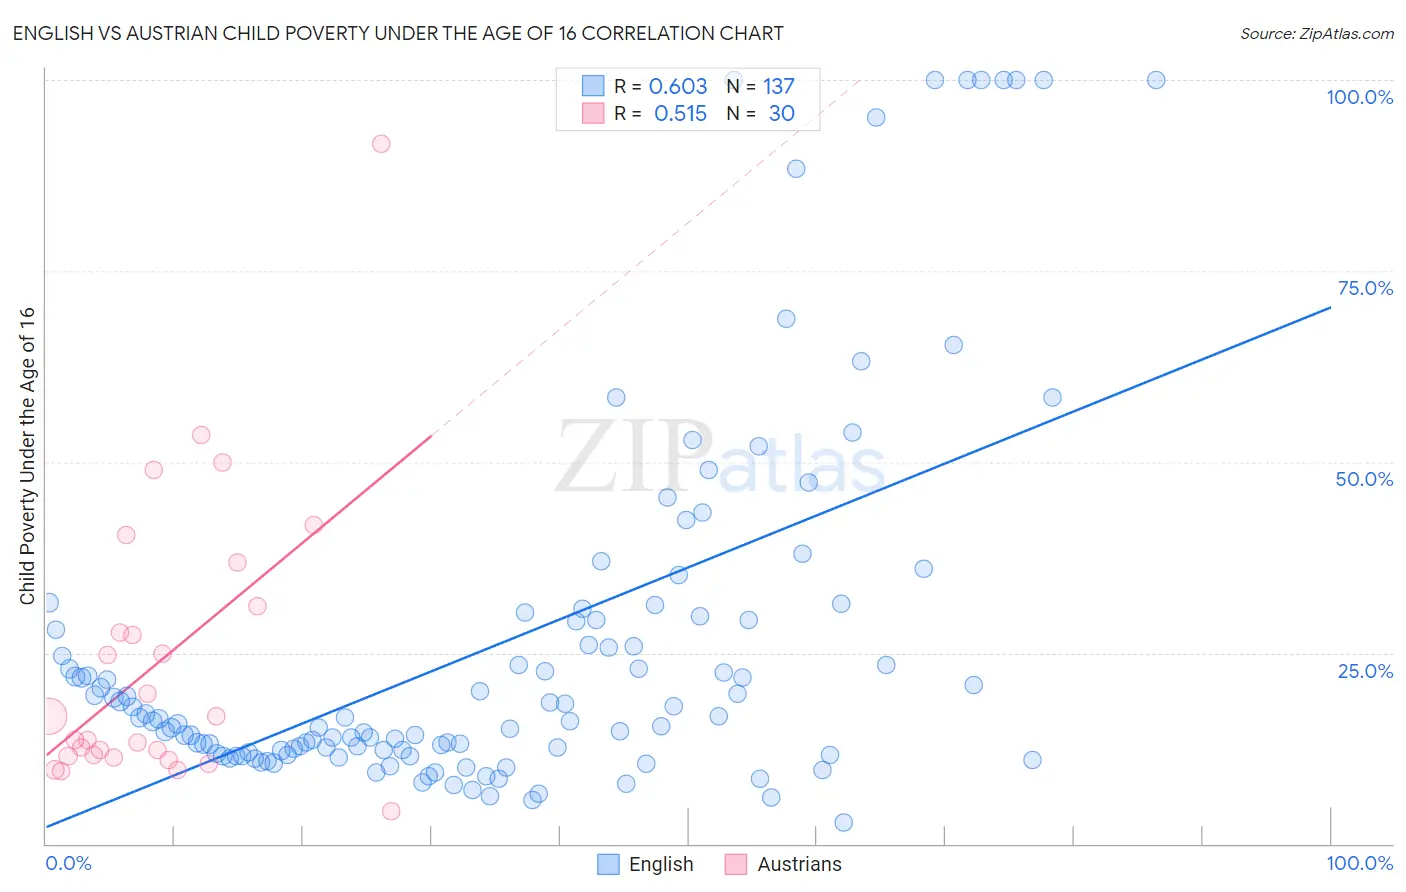
English vs Austrian Child Poverty Under the Age of 16 Correlation Chart
The statistical analysis conducted on geographies consisting of 565,080,494 people shows a significant positive correlation between the proportion of English and poverty level among children under the age of 16 in the United States with a correlation coefficient (R) of 0.603 and weighted average of 14.9%. Similarly, the statistical analysis conducted on geographies consisting of 445,410,621 people shows a substantial positive correlation between the proportion of Austrians and poverty level among children under the age of 16 in the United States with a correlation coefficient (R) of 0.515 and weighted average of 14.5%, a difference of 2.6%.
Child Poverty Under the Age of 16 Correlation Summary
| Measurement | English | Austrian |
| Minimum | 2.8% | 4.3% |
| Maximum | 100.0% | 91.7% |
| Range | 97.2% | 87.4% |
| Mean | 26.1% | 23.9% |
| Median | 16.3% | 15.1% |
| Interquartile 25% (IQ1) | 11.9% | 11.5% |
| Interquartile 75% (IQ3) | 29.3% | 31.1% |
| Interquartile Range (IQR) | 17.3% | 19.6% |
| Standard Deviation (Sample) | 24.2% | 18.8% |
| Standard Deviation (Population) | 24.1% | 18.5% |
Demographics Similar to English and Austrians by Child Poverty Under the Age of 16
In terms of child poverty under the age of 16, the demographic groups most similar to English are Tlingit-Haida (14.9%, a difference of 0.34%), Jordanian (14.8%, a difference of 0.41%), Chilean (14.8%, a difference of 0.50%), Serbian (14.8%, a difference of 0.56%), and Basque (14.8%, a difference of 0.69%). Similarly, the demographic groups most similar to Austrians are Immigrants from North America (14.6%, a difference of 0.18%), Immigrants from Italy (14.6%, a difference of 0.21%), Argentinean (14.6%, a difference of 0.31%), Immigrants from South Africa (14.6%, a difference of 0.58%), and Immigrants from Croatia (14.6%, a difference of 0.75%).
| Demographics | Rating | Rank | Child Poverty Under the Age of 16 |
| Austrians | 96.9 /100 | #90 | Exceptional 14.5% |
| Immigrants | North America | 96.7 /100 | #91 | Exceptional 14.6% |
| Immigrants | Italy | 96.7 /100 | #92 | Exceptional 14.6% |
| Argentineans | 96.6 /100 | #93 | Exceptional 14.6% |
| Immigrants | South Africa | 96.3 /100 | #94 | Exceptional 14.6% |
| Immigrants | Croatia | 96.1 /100 | #95 | Exceptional 14.6% |
| Immigrants | France | 95.8 /100 | #96 | Exceptional 14.7% |
| Paraguayans | 95.7 /100 | #97 | Exceptional 14.7% |
| Immigrants | Belarus | 95.7 /100 | #98 | Exceptional 14.7% |
| British | 95.5 /100 | #99 | Exceptional 14.7% |
| Dutch | 95.1 /100 | #100 | Exceptional 14.8% |
| Immigrants | Switzerland | 95.1 /100 | #101 | Exceptional 14.8% |
| Romanians | 95.0 /100 | #102 | Exceptional 14.8% |
| Immigrants | Egypt | 94.9 /100 | #103 | Exceptional 14.8% |
| Immigrants | England | 94.8 /100 | #104 | Exceptional 14.8% |
| Basques | 94.7 /100 | #105 | Exceptional 14.8% |
| Serbians | 94.5 /100 | #106 | Exceptional 14.8% |
| Chileans | 94.4 /100 | #107 | Exceptional 14.8% |
| Jordanians | 94.2 /100 | #108 | Exceptional 14.8% |
| Tlingit-Haida | 94.1 /100 | #109 | Exceptional 14.9% |
| English | 93.5 /100 | #110 | Exceptional 14.9% |