Egyptian vs Norwegian Cognitive Disability
COMPARE
Egyptian
Norwegian
Cognitive Disability
Cognitive Disability Comparison
Egyptians
Norwegians
16.7%
COGNITIVE DISABILITY
99.2/ 100
METRIC RATING
80th/ 347
METRIC RANK
16.5%
COGNITIVE DISABILITY
99.8/ 100
METRIC RATING
50th/ 347
METRIC RANK
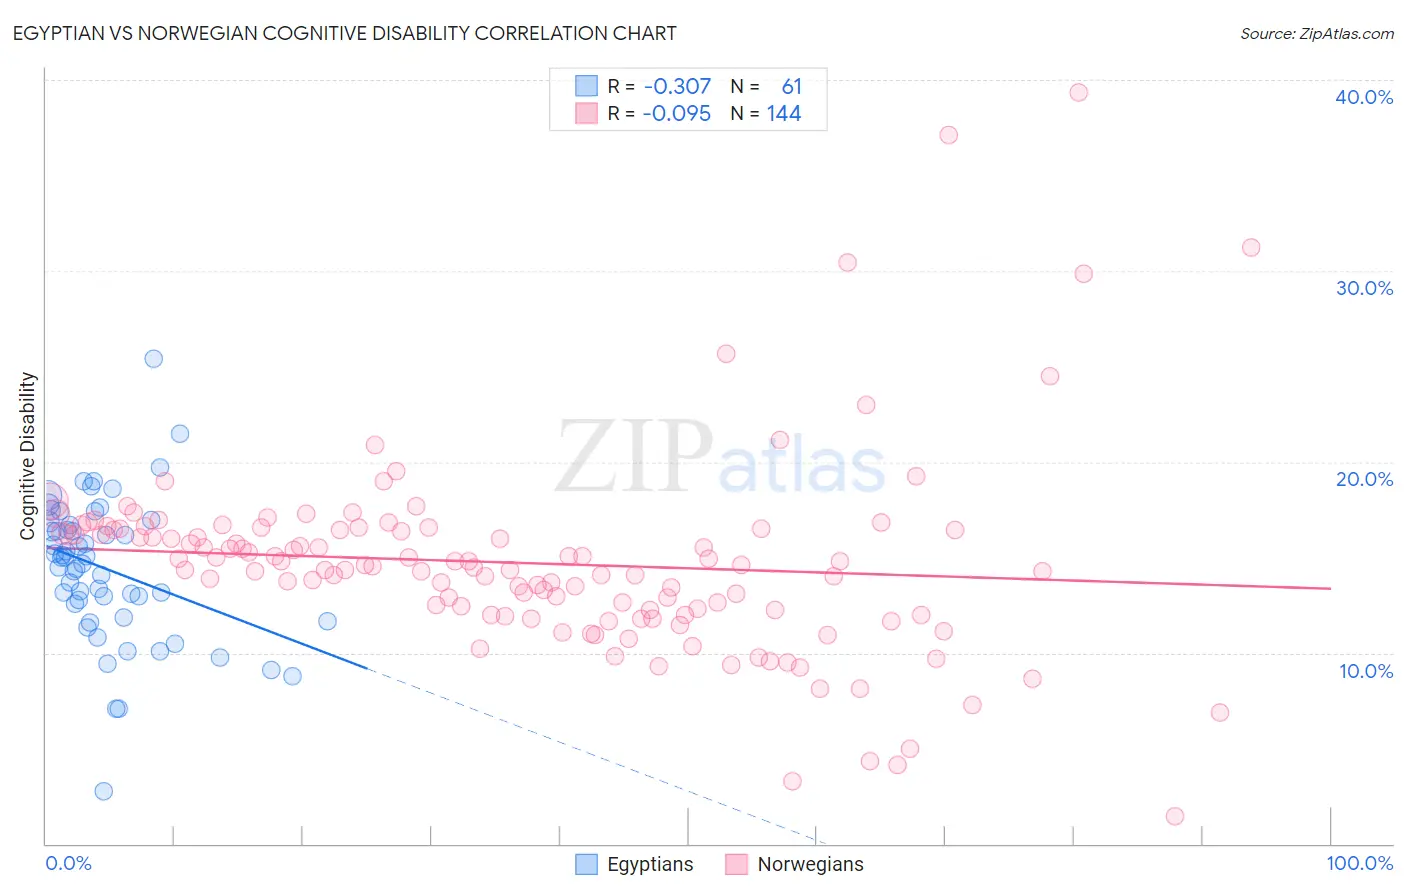
Egyptian vs Norwegian Cognitive Disability Correlation Chart
The statistical analysis conducted on geographies consisting of 276,907,223 people shows a mild negative correlation between the proportion of Egyptians and percentage of population with cognitive disability in the United States with a correlation coefficient (R) of -0.307 and weighted average of 16.7%. Similarly, the statistical analysis conducted on geographies consisting of 533,251,641 people shows a slight negative correlation between the proportion of Norwegians and percentage of population with cognitive disability in the United States with a correlation coefficient (R) of -0.095 and weighted average of 16.5%, a difference of 1.1%.
Cognitive Disability Correlation Summary
| Measurement | Egyptian | Norwegian |
| Minimum | 2.7% | 1.5% |
| Maximum | 25.4% | 39.3% |
| Range | 22.7% | 37.9% |
| Mean | 14.4% | 14.7% |
| Median | 15.0% | 14.6% |
| Interquartile 25% (IQ1) | 12.2% | 12.1% |
| Interquartile 75% (IQ3) | 16.8% | 16.5% |
| Interquartile Range (IQR) | 4.6% | 4.4% |
| Standard Deviation (Sample) | 3.8% | 5.2% |
| Standard Deviation (Population) | 3.7% | 5.1% |
Similar Demographics by Cognitive Disability
Demographics Similar to Egyptians by Cognitive Disability
In terms of cognitive disability, the demographic groups most similar to Egyptians are Immigrants from Netherlands (16.7%, a difference of 0.010%), Peruvian (16.7%, a difference of 0.030%), Immigrants from Bulgaria (16.7%, a difference of 0.030%), Immigrants from Serbia (16.7%, a difference of 0.040%), and Immigrants from Hungary (16.7%, a difference of 0.040%).
| Demographics | Rating | Rank | Cognitive Disability |
| Burmese | 99.3 /100 | #73 | Exceptional 16.7% |
| Slavs | 99.3 /100 | #74 | Exceptional 16.7% |
| Estonians | 99.3 /100 | #75 | Exceptional 16.7% |
| Immigrants | Serbia | 99.3 /100 | #76 | Exceptional 16.7% |
| Immigrants | Hungary | 99.3 /100 | #77 | Exceptional 16.7% |
| Peruvians | 99.3 /100 | #78 | Exceptional 16.7% |
| Immigrants | Bulgaria | 99.3 /100 | #79 | Exceptional 16.7% |
| Egyptians | 99.2 /100 | #80 | Exceptional 16.7% |
| Immigrants | Netherlands | 99.2 /100 | #81 | Exceptional 16.7% |
| Swiss | 99.2 /100 | #82 | Exceptional 16.7% |
| Serbians | 99.1 /100 | #83 | Exceptional 16.7% |
| Belgians | 99.1 /100 | #84 | Exceptional 16.7% |
| Immigrants | Moldova | 99.1 /100 | #85 | Exceptional 16.7% |
| Immigrants | South Africa | 99.0 /100 | #86 | Exceptional 16.7% |
| Native Hawaiians | 99.0 /100 | #87 | Exceptional 16.7% |
Demographics Similar to Norwegians by Cognitive Disability
In terms of cognitive disability, the demographic groups most similar to Norwegians are Iranian (16.5%, a difference of 0.010%), Immigrants from Italy (16.5%, a difference of 0.050%), Immigrants from North America (16.5%, a difference of 0.050%), Immigrants from Korea (16.5%, a difference of 0.050%), and Immigrants from Colombia (16.5%, a difference of 0.080%).
| Demographics | Rating | Rank | Cognitive Disability |
| Immigrants | Canada | 99.8 /100 | #43 | Exceptional 16.5% |
| Macedonians | 99.8 /100 | #44 | Exceptional 16.5% |
| Immigrants | Europe | 99.8 /100 | #45 | Exceptional 16.5% |
| Immigrants | Colombia | 99.8 /100 | #46 | Exceptional 16.5% |
| Immigrants | Italy | 99.8 /100 | #47 | Exceptional 16.5% |
| Immigrants | North America | 99.8 /100 | #48 | Exceptional 16.5% |
| Iranians | 99.8 /100 | #49 | Exceptional 16.5% |
| Norwegians | 99.8 /100 | #50 | Exceptional 16.5% |
| Immigrants | Korea | 99.8 /100 | #51 | Exceptional 16.5% |
| Soviet Union | 99.8 /100 | #52 | Exceptional 16.5% |
| Swedes | 99.8 /100 | #53 | Exceptional 16.5% |
| Immigrants | Iran | 99.8 /100 | #54 | Exceptional 16.5% |
| Immigrants | Venezuela | 99.7 /100 | #55 | Exceptional 16.5% |
| Austrians | 99.7 /100 | #56 | Exceptional 16.6% |
| Bhutanese | 99.7 /100 | #57 | Exceptional 16.6% |