Egyptian vs Immigrants from Belarus Female Poverty Among 25-34 Year Olds
COMPARE
Egyptian
Immigrants from Belarus
Female Poverty Among 25-34 Year Olds
Female Poverty Among 25-34 Year Olds Comparison
Egyptians
Immigrants from Belarus
11.9%
FEMALE POVERTY AMONG 25-34 YEAR OLDS
99.7/ 100
METRIC RATING
43rd/ 347
METRIC RANK
12.0%
FEMALE POVERTY AMONG 25-34 YEAR OLDS
99.6/ 100
METRIC RATING
48th/ 347
METRIC RANK
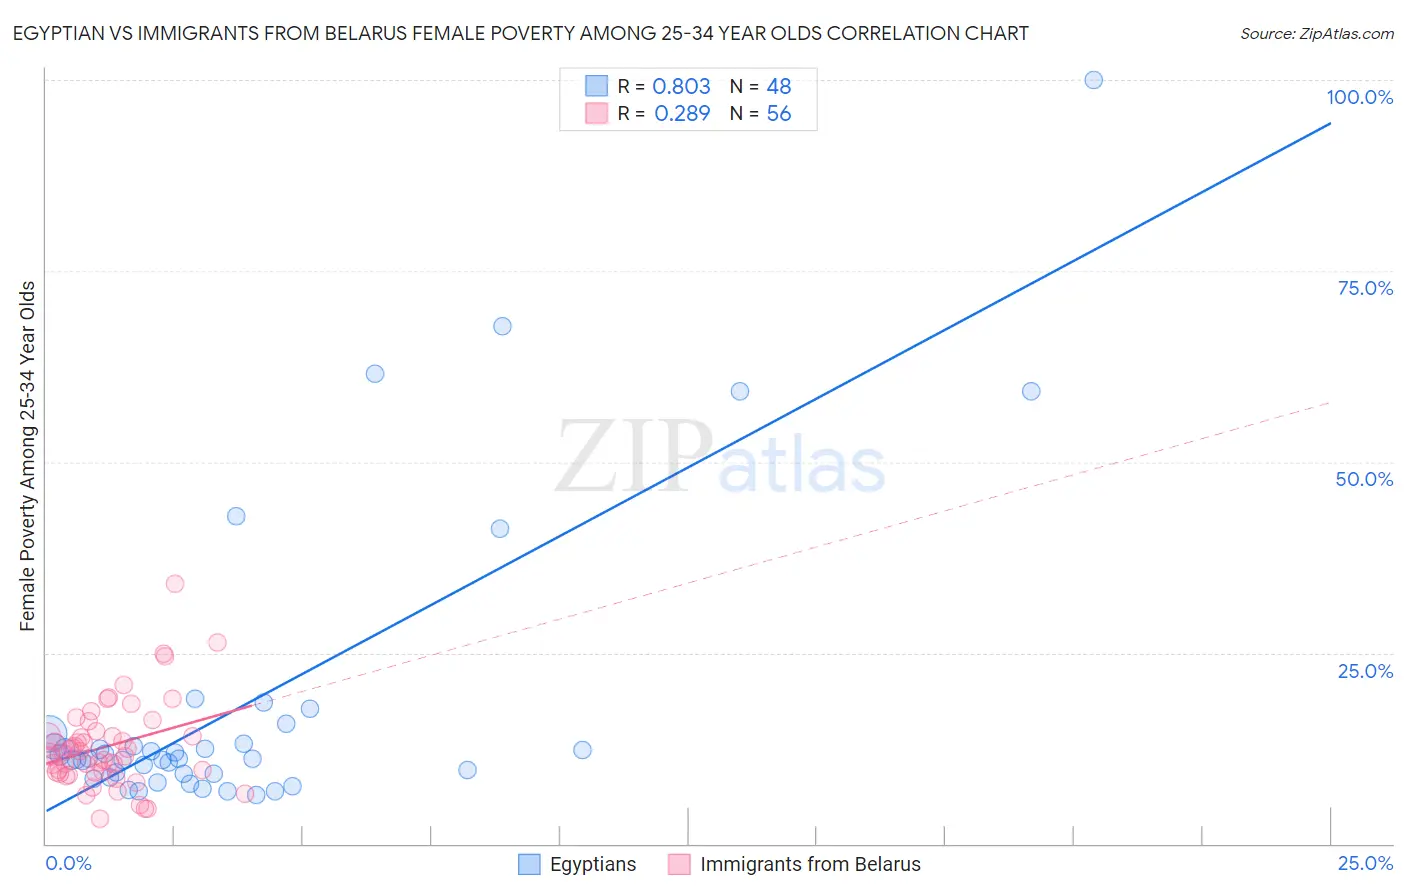
Egyptian vs Immigrants from Belarus Female Poverty Among 25-34 Year Olds Correlation Chart
The statistical analysis conducted on geographies consisting of 273,751,830 people shows a very strong positive correlation between the proportion of Egyptians and poverty level among females between the ages 25 and 34 in the United States with a correlation coefficient (R) of 0.803 and weighted average of 11.9%. Similarly, the statistical analysis conducted on geographies consisting of 148,573,178 people shows a weak positive correlation between the proportion of Immigrants from Belarus and poverty level among females between the ages 25 and 34 in the United States with a correlation coefficient (R) of 0.289 and weighted average of 12.0%, a difference of 0.50%.
Female Poverty Among 25-34 Year Olds Correlation Summary
| Measurement | Egyptian | Immigrants from Belarus |
| Minimum | 6.4% | 3.3% |
| Maximum | 100.0% | 34.0% |
| Range | 93.6% | 30.7% |
| Mean | 18.4% | 12.8% |
| Median | 11.1% | 11.9% |
| Interquartile 25% (IQ1) | 9.1% | 9.4% |
| Interquartile 75% (IQ3) | 13.7% | 14.4% |
| Interquartile Range (IQR) | 4.6% | 5.0% |
| Standard Deviation (Sample) | 19.6% | 5.7% |
| Standard Deviation (Population) | 19.4% | 5.7% |
Demographics Similar to Egyptians and Immigrants from Belarus by Female Poverty Among 25-34 Year Olds
In terms of female poverty among 25-34 year olds, the demographic groups most similar to Egyptians are Immigrants from Australia (11.9%, a difference of 0.010%), Immigrants from Turkey (11.9%, a difference of 0.25%), Macedonian (11.9%, a difference of 0.28%), Immigrants from Serbia (11.9%, a difference of 0.29%), and Korean (12.0%, a difference of 0.45%). Similarly, the demographic groups most similar to Immigrants from Belarus are Korean (12.0%, a difference of 0.050%), Immigrants from Egypt (12.0%, a difference of 0.080%), Immigrants from Croatia (12.0%, a difference of 0.090%), Paraguayan (12.0%, a difference of 0.10%), and Immigrants from Eastern Europe (12.0%, a difference of 0.12%).
| Demographics | Rating | Rank | Female Poverty Among 25-34 Year Olds |
| Cambodians | 99.9 /100 | #35 | Exceptional 11.7% |
| Immigrants | Sri Lanka | 99.8 /100 | #36 | Exceptional 11.8% |
| Taiwanese | 99.8 /100 | #37 | Exceptional 11.8% |
| Immigrants | North Macedonia | 99.8 /100 | #38 | Exceptional 11.8% |
| Latvians | 99.8 /100 | #39 | Exceptional 11.8% |
| Immigrants | Bulgaria | 99.8 /100 | #40 | Exceptional 11.8% |
| Immigrants | Indonesia | 99.8 /100 | #41 | Exceptional 11.8% |
| Immigrants | Turkey | 99.7 /100 | #42 | Exceptional 11.9% |
| Egyptians | 99.7 /100 | #43 | Exceptional 11.9% |
| Immigrants | Australia | 99.7 /100 | #44 | Exceptional 11.9% |
| Macedonians | 99.7 /100 | #45 | Exceptional 11.9% |
| Immigrants | Serbia | 99.7 /100 | #46 | Exceptional 11.9% |
| Koreans | 99.6 /100 | #47 | Exceptional 12.0% |
| Immigrants | Belarus | 99.6 /100 | #48 | Exceptional 12.0% |
| Immigrants | Egypt | 99.6 /100 | #49 | Exceptional 12.0% |
| Immigrants | Croatia | 99.6 /100 | #50 | Exceptional 12.0% |
| Paraguayans | 99.6 /100 | #51 | Exceptional 12.0% |
| Immigrants | Eastern Europe | 99.6 /100 | #52 | Exceptional 12.0% |
| Immigrants | Israel | 99.6 /100 | #53 | Exceptional 12.0% |
| Eastern Europeans | 99.6 /100 | #54 | Exceptional 12.0% |
| Immigrants | Philippines | 99.5 /100 | #55 | Exceptional 12.0% |