Egyptian vs Immigrants from St. Vincent and the Grenadines Male Disability
COMPARE
Egyptian
Immigrants from St. Vincent and the Grenadines
Male Disability
Male Disability Comparison
Egyptians
Immigrants from St. Vincent and the Grenadines
10.1%
MALE DISABILITY
99.9/ 100
METRIC RATING
27th/ 347
METRIC RANK
10.7%
MALE DISABILITY
97.1/ 100
METRIC RATING
93rd/ 347
METRIC RANK
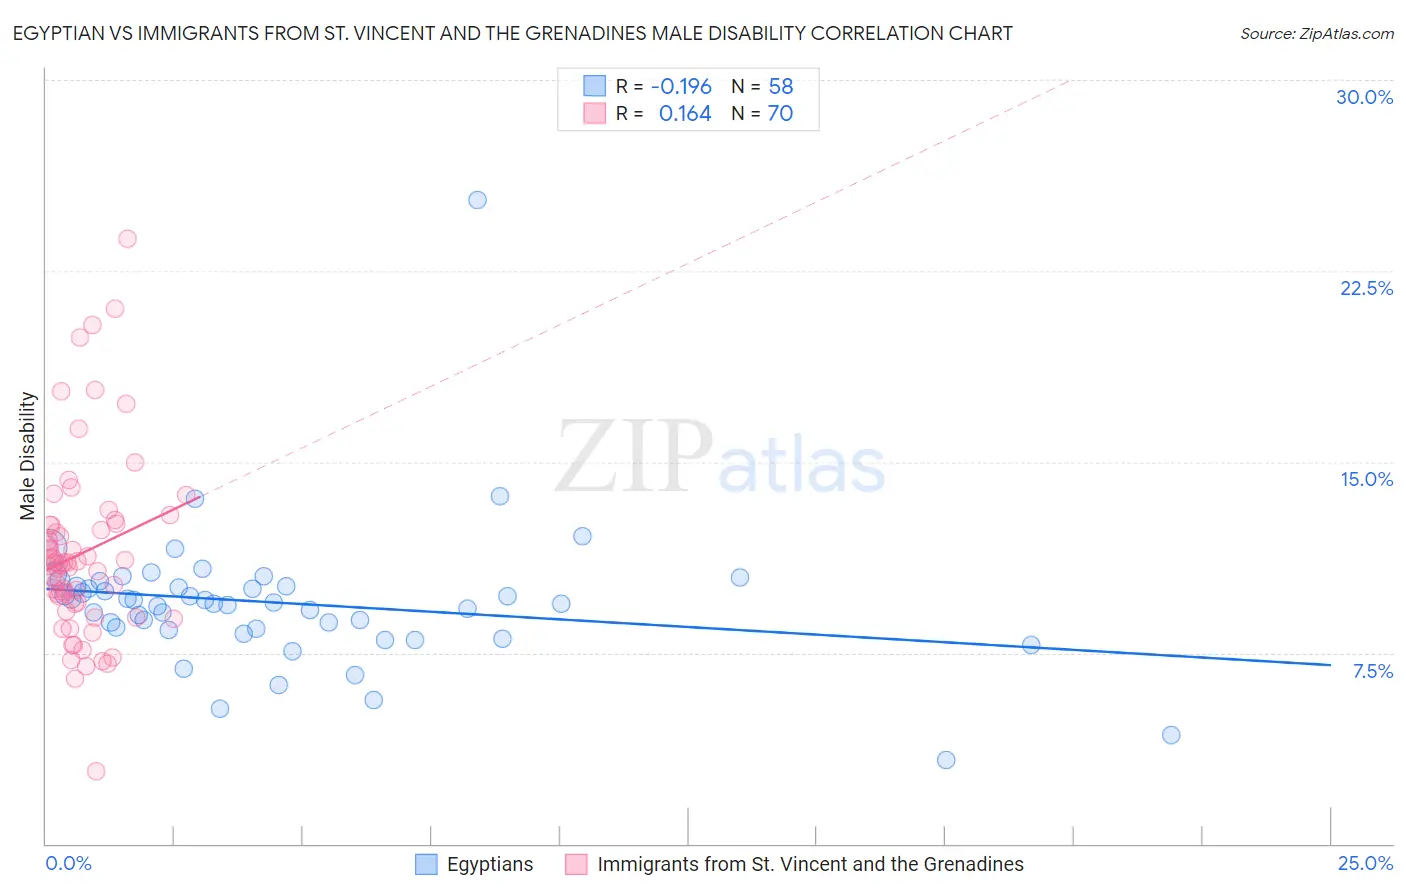
Egyptian vs Immigrants from St. Vincent and the Grenadines Male Disability Correlation Chart
The statistical analysis conducted on geographies consisting of 276,912,725 people shows a poor negative correlation between the proportion of Egyptians and percentage of males with a disability in the United States with a correlation coefficient (R) of -0.196 and weighted average of 10.1%. Similarly, the statistical analysis conducted on geographies consisting of 56,189,334 people shows a poor positive correlation between the proportion of Immigrants from St. Vincent and the Grenadines and percentage of males with a disability in the United States with a correlation coefficient (R) of 0.164 and weighted average of 10.7%, a difference of 5.7%.
Male Disability Correlation Summary
| Measurement | Egyptian | Immigrants from St. Vincent and the Grenadines |
| Minimum | 3.3% | 2.8% |
| Maximum | 25.3% | 23.8% |
| Range | 22.0% | 20.9% |
| Mean | 9.5% | 11.4% |
| Median | 9.4% | 11.0% |
| Interquartile 25% (IQ1) | 8.5% | 9.4% |
| Interquartile 75% (IQ3) | 10.1% | 12.5% |
| Interquartile Range (IQR) | 1.6% | 3.1% |
| Standard Deviation (Sample) | 2.8% | 3.6% |
| Standard Deviation (Population) | 2.8% | 3.6% |
Similar Demographics by Male Disability
Demographics Similar to Egyptians by Male Disability
In terms of male disability, the demographic groups most similar to Egyptians are Vietnamese (10.1%, a difference of 0.020%), Venezuelan (10.1%, a difference of 0.17%), Immigrants from Egypt (10.1%, a difference of 0.21%), Soviet Union (10.1%, a difference of 0.28%), and Paraguayan (10.1%, a difference of 0.32%).
| Demographics | Rating | Rank | Male Disability |
| Asians | 100.0 /100 | #20 | Exceptional 10.0% |
| Burmese | 100.0 /100 | #21 | Exceptional 10.0% |
| Immigrants | Venezuela | 100.0 /100 | #22 | Exceptional 10.0% |
| Cypriots | 100.0 /100 | #23 | Exceptional 10.0% |
| Immigrants | Asia | 100.0 /100 | #24 | Exceptional 10.0% |
| Immigrants | Malaysia | 99.9 /100 | #25 | Exceptional 10.0% |
| Paraguayans | 99.9 /100 | #26 | Exceptional 10.1% |
| Egyptians | 99.9 /100 | #27 | Exceptional 10.1% |
| Vietnamese | 99.9 /100 | #28 | Exceptional 10.1% |
| Venezuelans | 99.9 /100 | #29 | Exceptional 10.1% |
| Immigrants | Egypt | 99.9 /100 | #30 | Exceptional 10.1% |
| Soviet Union | 99.9 /100 | #31 | Exceptional 10.1% |
| Argentineans | 99.9 /100 | #32 | Exceptional 10.1% |
| Immigrants | Ethiopia | 99.9 /100 | #33 | Exceptional 10.2% |
| Immigrants | Turkey | 99.9 /100 | #34 | Exceptional 10.2% |
Demographics Similar to Immigrants from St. Vincent and the Grenadines by Male Disability
In terms of male disability, the demographic groups most similar to Immigrants from St. Vincent and the Grenadines are Immigrants from Sweden (10.7%, a difference of 0.11%), Palestinian (10.7%, a difference of 0.13%), Chilean (10.7%, a difference of 0.14%), Nicaraguan (10.7%, a difference of 0.24%), and Immigrants from Armenia (10.7%, a difference of 0.26%).
| Demographics | Rating | Rank | Male Disability |
| Immigrants | Ireland | 97.9 /100 | #86 | Exceptional 10.6% |
| Immigrants | Vietnam | 97.9 /100 | #87 | Exceptional 10.6% |
| Immigrants | Western Asia | 97.8 /100 | #88 | Exceptional 10.6% |
| Immigrants | Nicaragua | 97.8 /100 | #89 | Exceptional 10.6% |
| Immigrants | Morocco | 97.7 /100 | #90 | Exceptional 10.6% |
| Immigrants | France | 97.6 /100 | #91 | Exceptional 10.6% |
| Palestinians | 97.4 /100 | #92 | Exceptional 10.7% |
| Immigrants | St. Vincent and the Grenadines | 97.1 /100 | #93 | Exceptional 10.7% |
| Immigrants | Sweden | 96.9 /100 | #94 | Exceptional 10.7% |
| Chileans | 96.9 /100 | #95 | Exceptional 10.7% |
| Nicaraguans | 96.6 /100 | #96 | Exceptional 10.7% |
| Immigrants | Armenia | 96.6 /100 | #97 | Exceptional 10.7% |
| Immigrants | Romania | 96.5 /100 | #98 | Exceptional 10.7% |
| Immigrants | Switzerland | 96.1 /100 | #99 | Exceptional 10.7% |
| Immigrants | Kazakhstan | 95.9 /100 | #100 | Exceptional 10.7% |