Egyptian vs Cajun Male Disability
COMPARE
Egyptian
Cajun
Male Disability
Male Disability Comparison
Egyptians
Cajuns
10.1%
MALE DISABILITY
99.9/ 100
METRIC RATING
27th/ 347
METRIC RANK
14.4%
MALE DISABILITY
0.0/ 100
METRIC RATING
329th/ 347
METRIC RANK
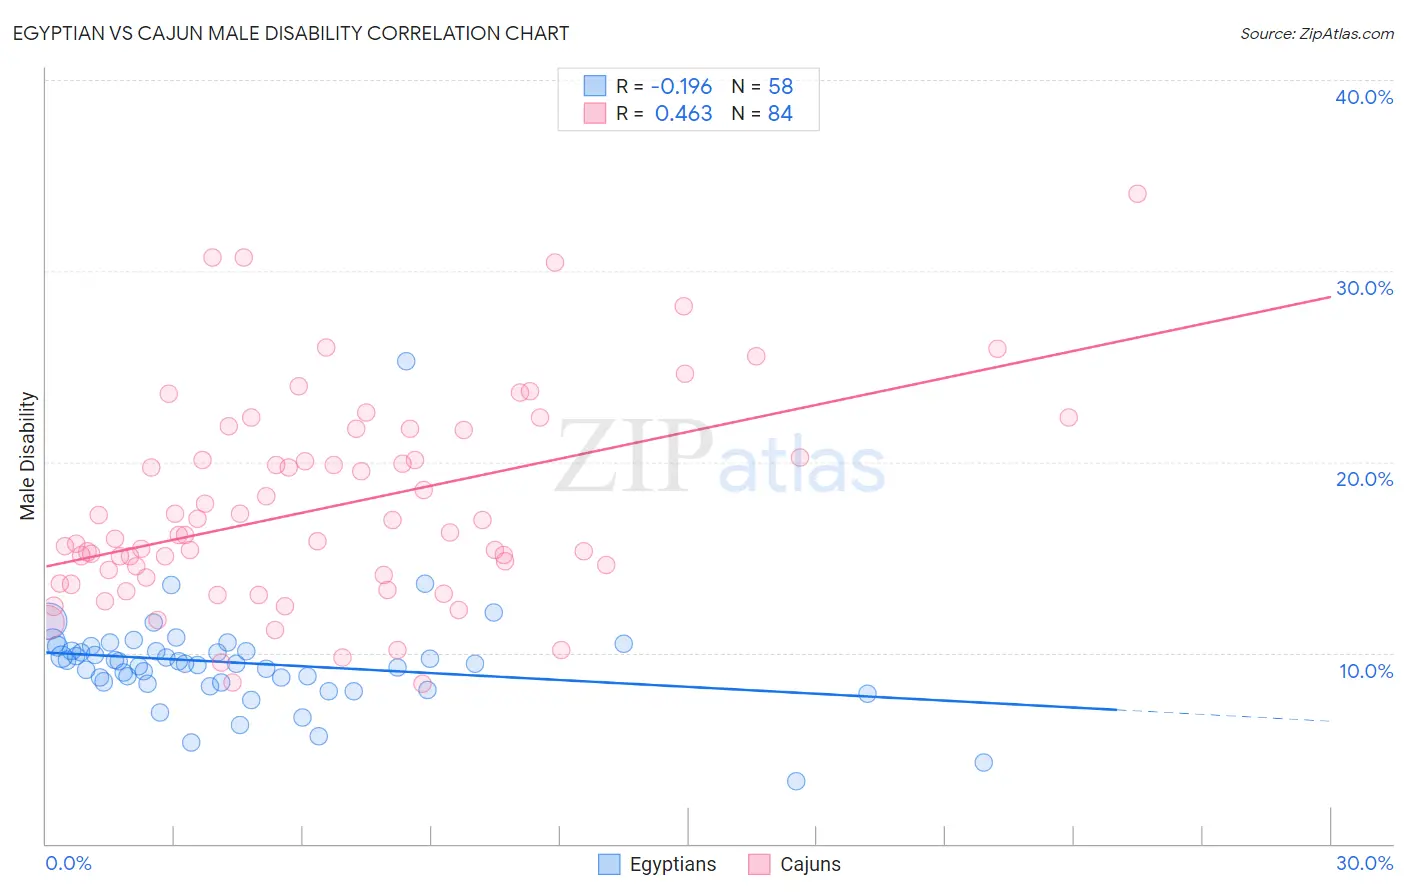
Egyptian vs Cajun Male Disability Correlation Chart
The statistical analysis conducted on geographies consisting of 276,912,725 people shows a poor negative correlation between the proportion of Egyptians and percentage of males with a disability in the United States with a correlation coefficient (R) of -0.196 and weighted average of 10.1%. Similarly, the statistical analysis conducted on geographies consisting of 149,697,026 people shows a moderate positive correlation between the proportion of Cajuns and percentage of males with a disability in the United States with a correlation coefficient (R) of 0.463 and weighted average of 14.4%, a difference of 42.3%.
Male Disability Correlation Summary
| Measurement | Egyptian | Cajun |
| Minimum | 3.3% | 8.4% |
| Maximum | 25.3% | 34.1% |
| Range | 22.0% | 25.7% |
| Mean | 9.5% | 17.7% |
| Median | 9.4% | 16.2% |
| Interquartile 25% (IQ1) | 8.5% | 14.0% |
| Interquartile 75% (IQ3) | 10.1% | 21.0% |
| Interquartile Range (IQR) | 1.6% | 7.0% |
| Standard Deviation (Sample) | 2.8% | 5.4% |
| Standard Deviation (Population) | 2.8% | 5.4% |
Similar Demographics by Male Disability
Demographics Similar to Egyptians by Male Disability
In terms of male disability, the demographic groups most similar to Egyptians are Vietnamese (10.1%, a difference of 0.020%), Venezuelan (10.1%, a difference of 0.17%), Immigrants from Egypt (10.1%, a difference of 0.21%), Soviet Union (10.1%, a difference of 0.28%), and Paraguayan (10.1%, a difference of 0.32%).
| Demographics | Rating | Rank | Male Disability |
| Asians | 100.0 /100 | #20 | Exceptional 10.0% |
| Burmese | 100.0 /100 | #21 | Exceptional 10.0% |
| Immigrants | Venezuela | 100.0 /100 | #22 | Exceptional 10.0% |
| Cypriots | 100.0 /100 | #23 | Exceptional 10.0% |
| Immigrants | Asia | 100.0 /100 | #24 | Exceptional 10.0% |
| Immigrants | Malaysia | 99.9 /100 | #25 | Exceptional 10.0% |
| Paraguayans | 99.9 /100 | #26 | Exceptional 10.1% |
| Egyptians | 99.9 /100 | #27 | Exceptional 10.1% |
| Vietnamese | 99.9 /100 | #28 | Exceptional 10.1% |
| Venezuelans | 99.9 /100 | #29 | Exceptional 10.1% |
| Immigrants | Egypt | 99.9 /100 | #30 | Exceptional 10.1% |
| Soviet Union | 99.9 /100 | #31 | Exceptional 10.1% |
| Argentineans | 99.9 /100 | #32 | Exceptional 10.1% |
| Immigrants | Ethiopia | 99.9 /100 | #33 | Exceptional 10.2% |
| Immigrants | Turkey | 99.9 /100 | #34 | Exceptional 10.2% |
Demographics Similar to Cajuns by Male Disability
In terms of male disability, the demographic groups most similar to Cajuns are Navajo (14.4%, a difference of 0.23%), Chippewa (14.3%, a difference of 0.57%), Potawatomi (14.2%, a difference of 1.0%), Native/Alaskan (14.2%, a difference of 1.1%), and Tohono O'odham (14.6%, a difference of 1.7%).
| Demographics | Rating | Rank | Male Disability |
| Apache | 0.0 /100 | #322 | Tragic 14.0% |
| Osage | 0.0 /100 | #323 | Tragic 14.0% |
| Comanche | 0.0 /100 | #324 | Tragic 14.1% |
| Ottawa | 0.0 /100 | #325 | Tragic 14.1% |
| Natives/Alaskans | 0.0 /100 | #326 | Tragic 14.2% |
| Potawatomi | 0.0 /100 | #327 | Tragic 14.2% |
| Chippewa | 0.0 /100 | #328 | Tragic 14.3% |
| Cajuns | 0.0 /100 | #329 | Tragic 14.4% |
| Navajo | 0.0 /100 | #330 | Tragic 14.4% |
| Tohono O'odham | 0.0 /100 | #331 | Tragic 14.6% |
| Seminole | 0.0 /100 | #332 | Tragic 14.7% |
| Yuman | 0.0 /100 | #333 | Tragic 14.7% |
| Cherokee | 0.0 /100 | #334 | Tragic 14.8% |
| Dutch West Indians | 0.0 /100 | #335 | Tragic 14.8% |
| Alaskan Athabascans | 0.0 /100 | #336 | Tragic 14.9% |