Ecuadorian vs Immigrants from Ghana Self-Care Disability
COMPARE
Ecuadorian
Immigrants from Ghana
Self-Care Disability
Self-Care Disability Comparison
Ecuadorians
Immigrants from Ghana
2.6%
SELF-CARE DISABILITY
4.7/ 100
METRIC RATING
213th/ 347
METRIC RANK
2.5%
SELF-CARE DISABILITY
14.7/ 100
METRIC RATING
199th/ 347
METRIC RANK
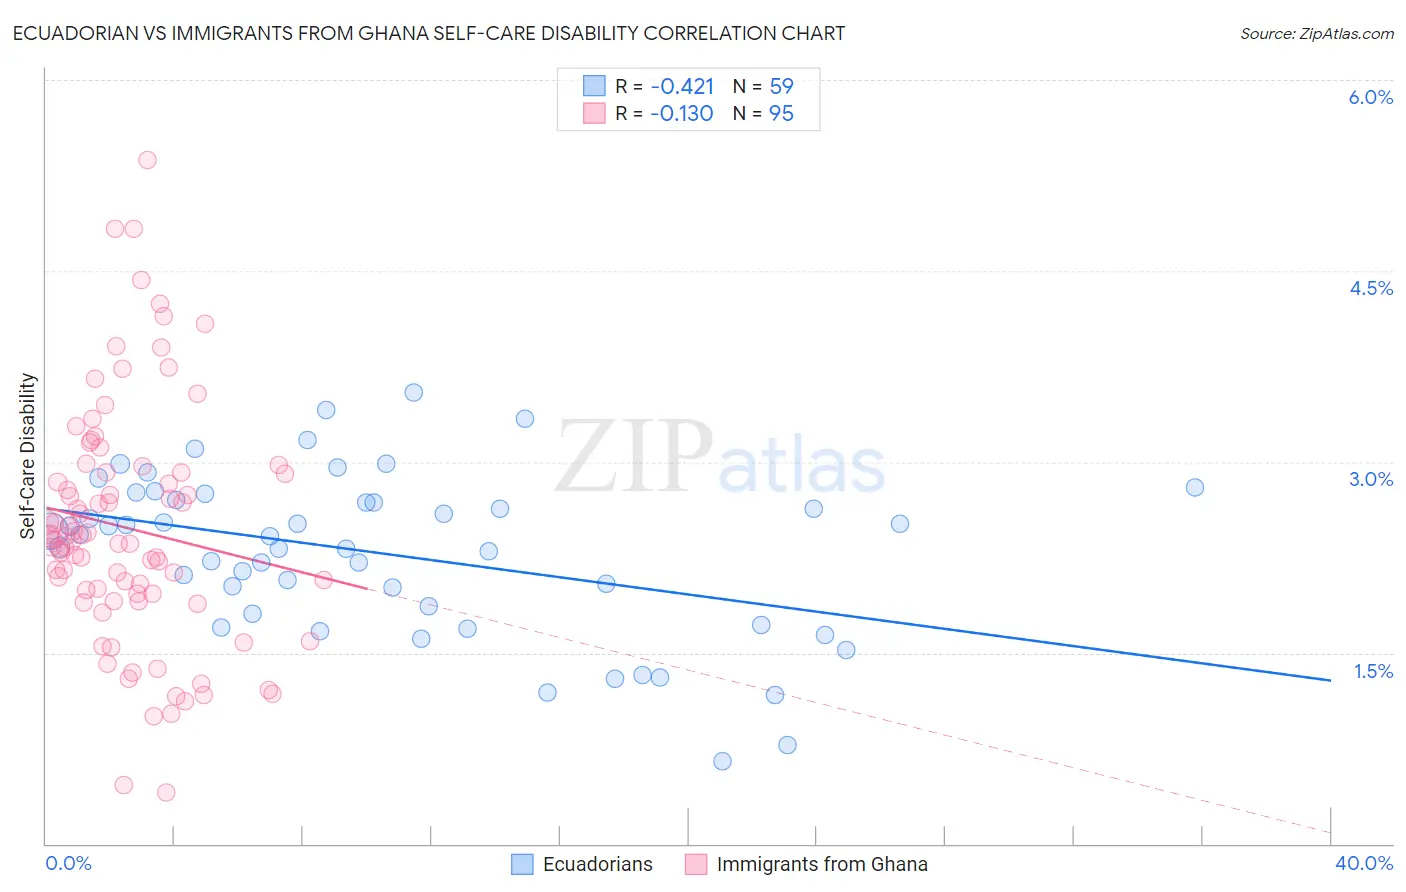
Ecuadorian vs Immigrants from Ghana Self-Care Disability Correlation Chart
The statistical analysis conducted on geographies consisting of 317,436,326 people shows a moderate negative correlation between the proportion of Ecuadorians and percentage of population with self-care disability in the United States with a correlation coefficient (R) of -0.421 and weighted average of 2.6%. Similarly, the statistical analysis conducted on geographies consisting of 199,790,257 people shows a poor negative correlation between the proportion of Immigrants from Ghana and percentage of population with self-care disability in the United States with a correlation coefficient (R) of -0.130 and weighted average of 2.5%, a difference of 1.5%.
Self-Care Disability Correlation Summary
| Measurement | Ecuadorian | Immigrants from Ghana |
| Minimum | 0.65% | 0.40% |
| Maximum | 3.5% | 5.4% |
| Range | 2.9% | 5.0% |
| Mean | 2.3% | 2.5% |
| Median | 2.4% | 2.4% |
| Interquartile 25% (IQ1) | 1.8% | 2.0% |
| Interquartile 75% (IQ3) | 2.7% | 2.9% |
| Interquartile Range (IQR) | 0.89% | 0.96% |
| Standard Deviation (Sample) | 0.64% | 0.94% |
| Standard Deviation (Population) | 0.63% | 0.94% |
Demographics Similar to Ecuadorians and Immigrants from Ghana by Self-Care Disability
In terms of self-care disability, the demographic groups most similar to Ecuadorians are Immigrants from Honduras (2.6%, a difference of 0.0%), Immigrants from Thailand (2.6%, a difference of 0.050%), White/Caucasian (2.6%, a difference of 0.070%), Samoan (2.6%, a difference of 0.10%), and Native Hawaiian (2.6%, a difference of 0.12%). Similarly, the demographic groups most similar to Immigrants from Ghana are Immigrants (2.5%, a difference of 0.020%), Crow (2.5%, a difference of 0.050%), Korean (2.5%, a difference of 0.070%), Immigrants from Western Africa (2.5%, a difference of 0.14%), and Immigrants from South Eastern Asia (2.5%, a difference of 0.18%).
| Demographics | Rating | Rank | Self-Care Disability |
| Koreans | 15.5 /100 | #196 | Poor 2.5% |
| Crow | 15.2 /100 | #197 | Poor 2.5% |
| Immigrants | Immigrants | 15.0 /100 | #198 | Poor 2.5% |
| Immigrants | Ghana | 14.7 /100 | #199 | Poor 2.5% |
| Immigrants | Western Africa | 13.3 /100 | #200 | Poor 2.5% |
| Immigrants | South Eastern Asia | 12.9 /100 | #201 | Poor 2.5% |
| Slovaks | 12.6 /100 | #202 | Poor 2.5% |
| Immigrants | Lebanon | 12.4 /100 | #203 | Poor 2.5% |
| Immigrants | Bahamas | 11.9 /100 | #204 | Poor 2.5% |
| Immigrants | Russia | 11.0 /100 | #205 | Poor 2.5% |
| Alaskan Athabascans | 10.4 /100 | #206 | Poor 2.5% |
| French | 9.9 /100 | #207 | Tragic 2.5% |
| Central Americans | 8.7 /100 | #208 | Tragic 2.5% |
| Malaysians | 7.7 /100 | #209 | Tragic 2.5% |
| Panamanians | 6.4 /100 | #210 | Tragic 2.5% |
| Native Hawaiians | 5.1 /100 | #211 | Tragic 2.6% |
| Samoans | 5.1 /100 | #212 | Tragic 2.6% |
| Ecuadorians | 4.7 /100 | #213 | Tragic 2.6% |
| Immigrants | Honduras | 4.7 /100 | #214 | Tragic 2.6% |
| Immigrants | Thailand | 4.5 /100 | #215 | Tragic 2.6% |
| Whites/Caucasians | 4.4 /100 | #216 | Tragic 2.6% |