Dutch vs Immigrants from Nicaragua Hearing Disability
COMPARE
Dutch
Immigrants from Nicaragua
Hearing Disability
Hearing Disability Comparison
Dutch
Immigrants from Nicaragua
3.7%
HEARING DISABILITY
0.0/ 100
METRIC RATING
302nd/ 347
METRIC RANK
2.7%
HEARING DISABILITY
99.0/ 100
METRIC RATING
56th/ 347
METRIC RANK
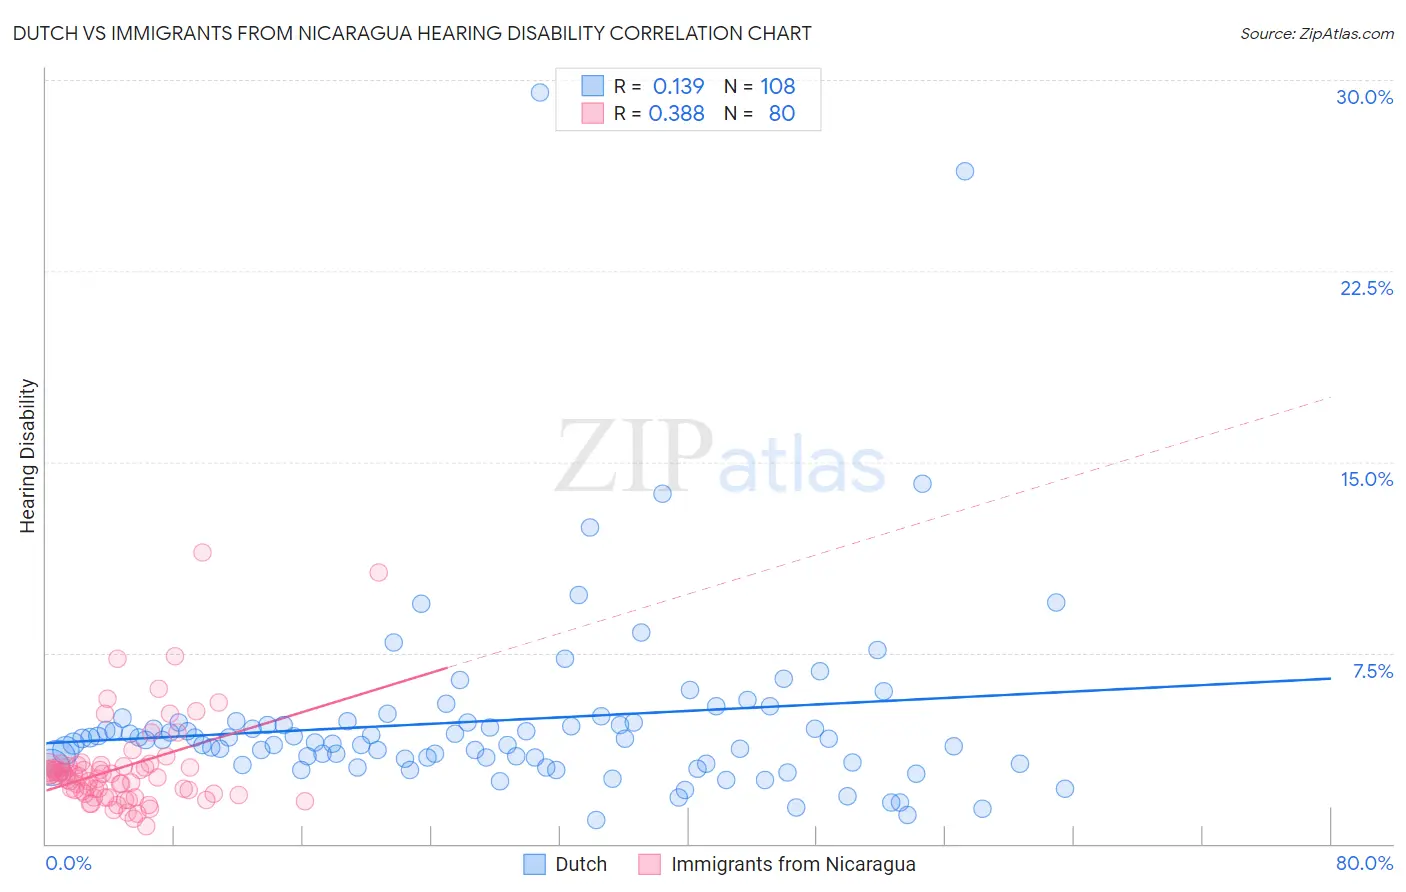
Dutch vs Immigrants from Nicaragua Hearing Disability Correlation Chart
The statistical analysis conducted on geographies consisting of 553,868,421 people shows a poor positive correlation between the proportion of Dutch and percentage of population with hearing disability in the United States with a correlation coefficient (R) of 0.139 and weighted average of 3.7%. Similarly, the statistical analysis conducted on geographies consisting of 236,296,931 people shows a mild positive correlation between the proportion of Immigrants from Nicaragua and percentage of population with hearing disability in the United States with a correlation coefficient (R) of 0.388 and weighted average of 2.7%, a difference of 39.9%.
Hearing Disability Correlation Summary
| Measurement | Dutch | Immigrants from Nicaragua |
| Minimum | 0.93% | 0.69% |
| Maximum | 29.5% | 11.4% |
| Range | 28.6% | 10.7% |
| Mean | 4.8% | 3.0% |
| Median | 4.1% | 2.6% |
| Interquartile 25% (IQ1) | 3.3% | 1.9% |
| Interquartile 75% (IQ3) | 4.8% | 3.0% |
| Interquartile Range (IQR) | 1.5% | 1.1% |
| Standard Deviation (Sample) | 3.9% | 1.8% |
| Standard Deviation (Population) | 3.9% | 1.8% |
Similar Demographics by Hearing Disability
Demographics Similar to Dutch by Hearing Disability
In terms of hearing disability, the demographic groups most similar to Dutch are Menominee (3.7%, a difference of 0.060%), Pennsylvania German (3.7%, a difference of 0.11%), Scottish (3.7%, a difference of 0.13%), German (3.7%, a difference of 0.20%), and French (3.8%, a difference of 0.36%).
| Demographics | Rating | Rank | Hearing Disability |
| Welsh | 0.0 /100 | #295 | Tragic 3.7% |
| Pima | 0.0 /100 | #296 | Tragic 3.7% |
| Immigrants | Azores | 0.0 /100 | #297 | Tragic 3.7% |
| Celtics | 0.0 /100 | #298 | Tragic 3.7% |
| Germans | 0.0 /100 | #299 | Tragic 3.7% |
| Scottish | 0.0 /100 | #300 | Tragic 3.7% |
| Pennsylvania Germans | 0.0 /100 | #301 | Tragic 3.7% |
| Dutch | 0.0 /100 | #302 | Tragic 3.7% |
| Menominee | 0.0 /100 | #303 | Tragic 3.7% |
| French | 0.0 /100 | #304 | Tragic 3.8% |
| English | 0.0 /100 | #305 | Tragic 3.8% |
| Marshallese | 0.0 /100 | #306 | Tragic 3.8% |
| French Canadians | 0.0 /100 | #307 | Tragic 3.8% |
| Ottawa | 0.0 /100 | #308 | Tragic 3.8% |
| Scotch-Irish | 0.0 /100 | #309 | Tragic 3.8% |
Demographics Similar to Immigrants from Nicaragua by Hearing Disability
In terms of hearing disability, the demographic groups most similar to Immigrants from Nicaragua are Immigrants from Ethiopia (2.7%, a difference of 0.020%), South American (2.7%, a difference of 0.040%), Ethiopian (2.7%, a difference of 0.090%), Immigrants from Eastern Asia (2.7%, a difference of 0.12%), and Jamaican (2.7%, a difference of 0.19%).
| Demographics | Rating | Rank | Hearing Disability |
| Immigrants | South America | 99.2 /100 | #49 | Exceptional 2.7% |
| Paraguayans | 99.2 /100 | #50 | Exceptional 2.7% |
| Immigrants | Hong Kong | 99.2 /100 | #51 | Exceptional 2.7% |
| Jamaicans | 99.0 /100 | #52 | Exceptional 2.7% |
| Immigrants | Eastern Asia | 99.0 /100 | #53 | Exceptional 2.7% |
| Ethiopians | 99.0 /100 | #54 | Exceptional 2.7% |
| Immigrants | Ethiopia | 99.0 /100 | #55 | Exceptional 2.7% |
| Immigrants | Nicaragua | 99.0 /100 | #56 | Exceptional 2.7% |
| South Americans | 99.0 /100 | #57 | Exceptional 2.7% |
| Immigrants | Peru | 98.6 /100 | #58 | Exceptional 2.7% |
| Immigrants | Eritrea | 98.5 /100 | #59 | Exceptional 2.7% |
| Immigrants | Egypt | 98.5 /100 | #60 | Exceptional 2.7% |
| Immigrants | Uzbekistan | 98.4 /100 | #61 | Exceptional 2.7% |
| Immigrants | Colombia | 98.4 /100 | #62 | Exceptional 2.7% |
| Indians (Asian) | 98.4 /100 | #63 | Exceptional 2.7% |