Delaware vs Immigrants from Australia Female Disability
COMPARE
Delaware
Immigrants from Australia
Female Disability
Female Disability Comparison
Delaware
Immigrants from Australia
13.8%
FEMALE DISABILITY
0.0/ 100
METRIC RATING
312th/ 347
METRIC RANK
11.1%
FEMALE DISABILITY
100.0/ 100
METRIC RATING
32nd/ 347
METRIC RANK
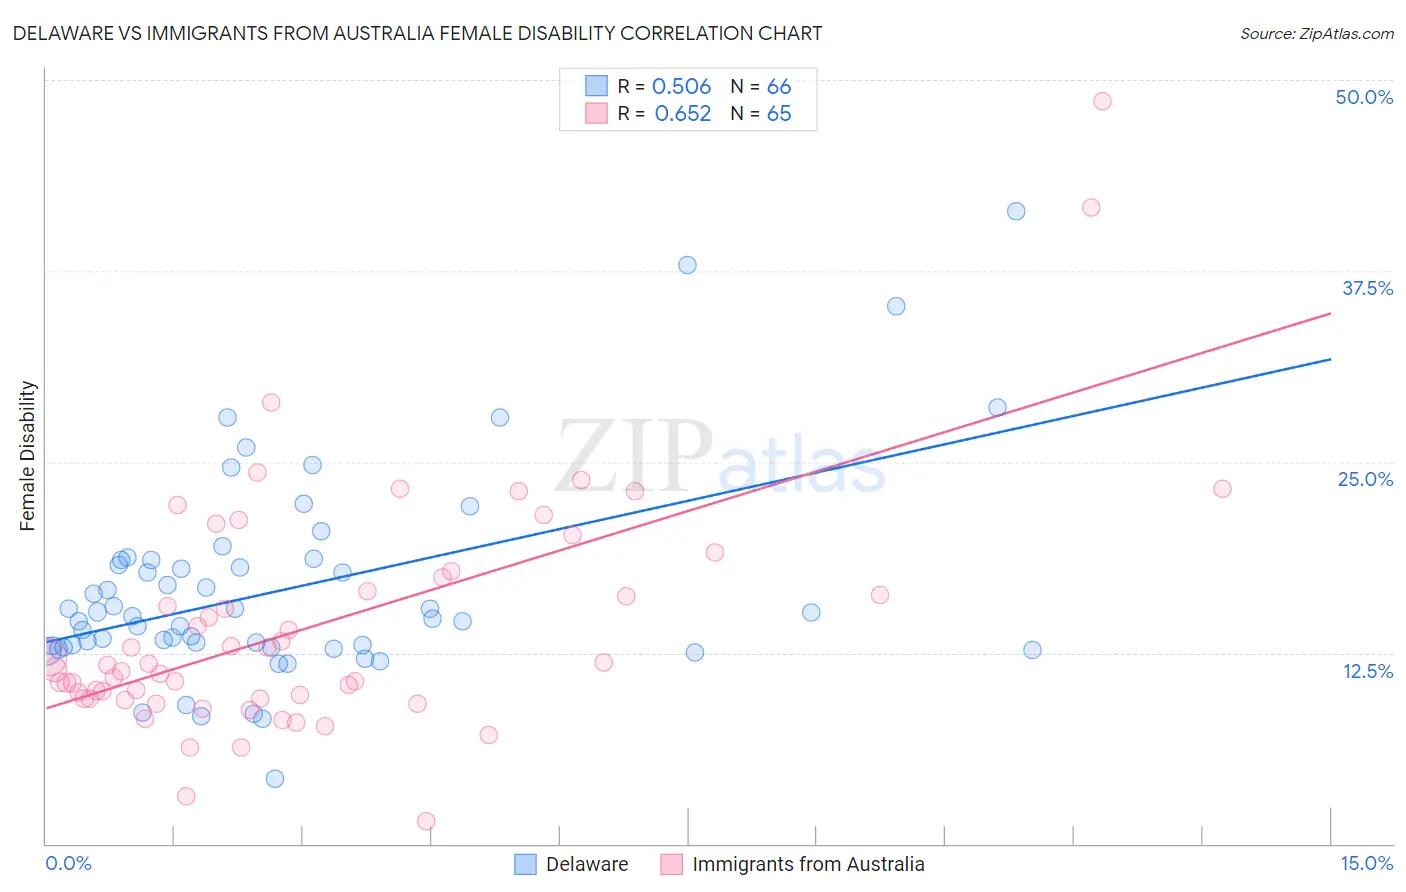
Delaware vs Immigrants from Australia Female Disability Correlation Chart
The statistical analysis conducted on geographies consisting of 96,239,773 people shows a substantial positive correlation between the proportion of Delaware and percentage of females with a disability in the United States with a correlation coefficient (R) of 0.506 and weighted average of 13.8%. Similarly, the statistical analysis conducted on geographies consisting of 227,197,779 people shows a significant positive correlation between the proportion of Immigrants from Australia and percentage of females with a disability in the United States with a correlation coefficient (R) of 0.652 and weighted average of 11.1%, a difference of 23.9%.
Female Disability Correlation Summary
| Measurement | Delaware | Immigrants from Australia |
| Minimum | 4.2% | 1.4% |
| Maximum | 41.4% | 48.6% |
| Range | 37.2% | 47.1% |
| Mean | 16.6% | 14.3% |
| Median | 14.8% | 11.7% |
| Interquartile 25% (IQ1) | 12.8% | 9.5% |
| Interquartile 75% (IQ3) | 18.5% | 17.7% |
| Interquartile Range (IQR) | 5.7% | 8.1% |
| Standard Deviation (Sample) | 6.8% | 7.9% |
| Standard Deviation (Population) | 6.7% | 7.9% |
Similar Demographics by Female Disability
Demographics Similar to Delaware by Female Disability
In terms of female disability, the demographic groups most similar to Delaware are Hopi (13.7%, a difference of 0.31%), Blackfeet (13.8%, a difference of 0.32%), Puget Sound Salish (13.8%, a difference of 0.42%), Apache (13.7%, a difference of 0.60%), and French American Indian (13.7%, a difference of 0.72%).
| Demographics | Rating | Rank | Female Disability |
| Dominicans | 0.0 /100 | #305 | Tragic 13.5% |
| French Canadians | 0.0 /100 | #306 | Tragic 13.6% |
| Central American Indians | 0.0 /100 | #307 | Tragic 13.6% |
| Cree | 0.0 /100 | #308 | Tragic 13.7% |
| French American Indians | 0.0 /100 | #309 | Tragic 13.7% |
| Apache | 0.0 /100 | #310 | Tragic 13.7% |
| Hopi | 0.0 /100 | #311 | Tragic 13.7% |
| Delaware | 0.0 /100 | #312 | Tragic 13.8% |
| Blackfeet | 0.0 /100 | #313 | Tragic 13.8% |
| Puget Sound Salish | 0.0 /100 | #314 | Tragic 13.8% |
| Alaskan Athabascans | 0.0 /100 | #315 | Tragic 13.9% |
| Spanish Americans | 0.0 /100 | #316 | Tragic 14.0% |
| Chippewa | 0.0 /100 | #317 | Tragic 14.0% |
| Paiute | 0.0 /100 | #318 | Tragic 14.0% |
| Iroquois | 0.0 /100 | #319 | Tragic 14.0% |
Demographics Similar to Immigrants from Australia by Female Disability
In terms of female disability, the demographic groups most similar to Immigrants from Australia are Immigrants from Egypt (11.1%, a difference of 0.080%), Immigrants from Kuwait (11.1%, a difference of 0.17%), Immigrants from Malaysia (11.1%, a difference of 0.27%), Turkish (11.1%, a difference of 0.27%), and Egyptian (11.1%, a difference of 0.33%).
| Demographics | Rating | Rank | Female Disability |
| Immigrants | Asia | 100.0 /100 | #25 | Exceptional 11.0% |
| Argentineans | 100.0 /100 | #26 | Exceptional 11.0% |
| Immigrants | Turkey | 100.0 /100 | #27 | Exceptional 11.1% |
| Egyptians | 100.0 /100 | #28 | Exceptional 11.1% |
| Immigrants | Malaysia | 100.0 /100 | #29 | Exceptional 11.1% |
| Turks | 100.0 /100 | #30 | Exceptional 11.1% |
| Immigrants | Kuwait | 100.0 /100 | #31 | Exceptional 11.1% |
| Immigrants | Australia | 100.0 /100 | #32 | Exceptional 11.1% |
| Immigrants | Egypt | 100.0 /100 | #33 | Exceptional 11.1% |
| Immigrants | Indonesia | 100.0 /100 | #34 | Exceptional 11.2% |
| Immigrants | Japan | 100.0 /100 | #35 | Exceptional 11.2% |
| Cypriots | 100.0 /100 | #36 | Exceptional 11.2% |
| Ethiopians | 100.0 /100 | #37 | Exceptional 11.2% |
| Immigrants | Ethiopia | 100.0 /100 | #38 | Exceptional 11.2% |
| Immigrants | Lithuania | 100.0 /100 | #39 | Exceptional 11.2% |