Nicaraguan vs Dutch Ambulatory Disability
COMPARE
Nicaraguan
Dutch
Ambulatory Disability
Ambulatory Disability Comparison
Nicaraguans
Dutch
6.1%
AMBULATORY DISABILITY
63.2/ 100
METRIC RATING
165th/ 347
METRIC RANK
6.4%
AMBULATORY DISABILITY
2.0/ 100
METRIC RATING
236th/ 347
METRIC RANK
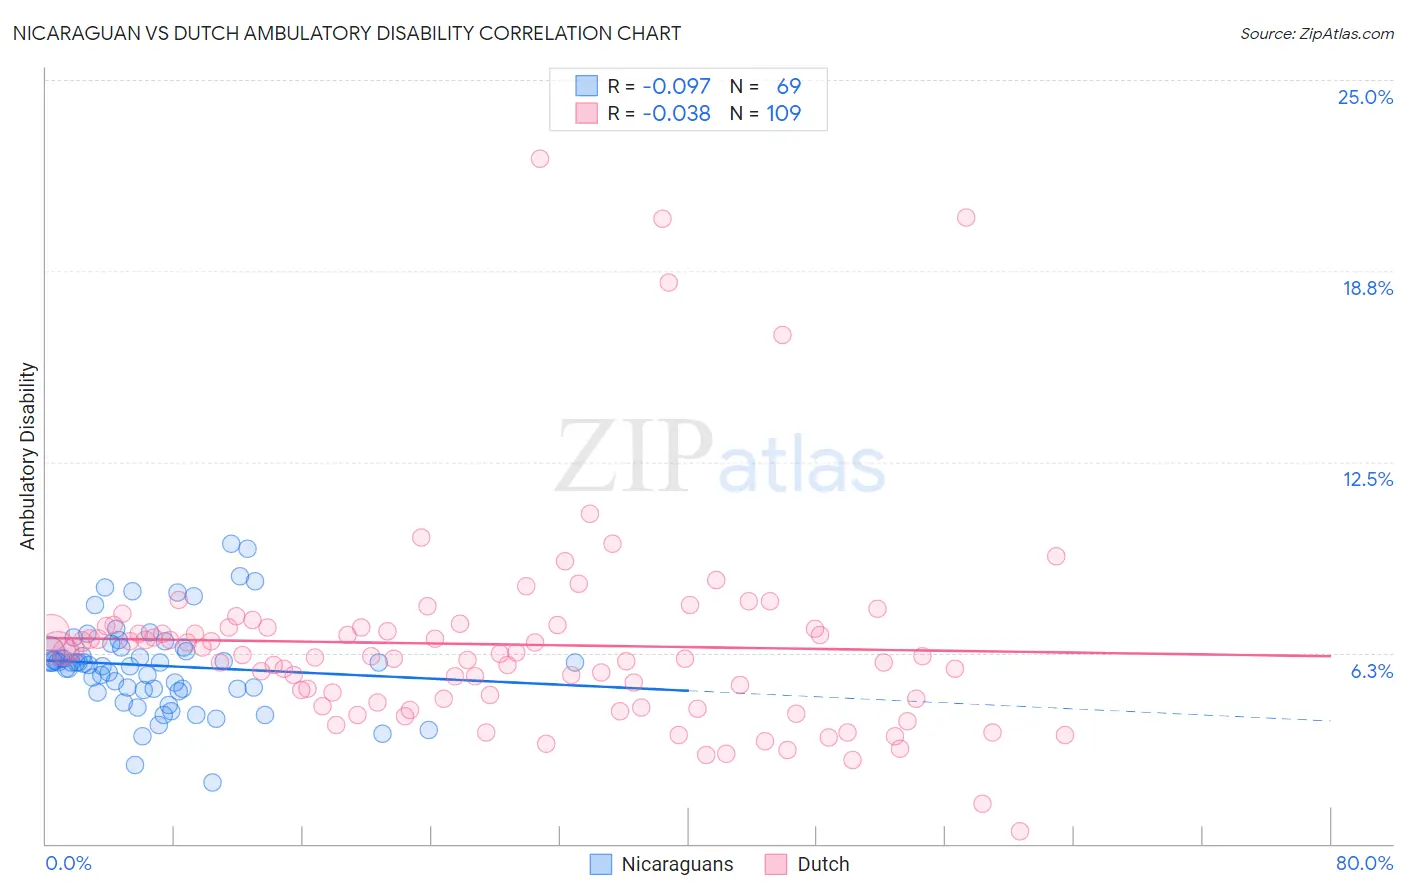
Nicaraguan vs Dutch Ambulatory Disability Correlation Chart
The statistical analysis conducted on geographies consisting of 285,681,314 people shows a slight negative correlation between the proportion of Nicaraguans and percentage of population with ambulatory disability in the United States with a correlation coefficient (R) of -0.097 and weighted average of 6.1%. Similarly, the statistical analysis conducted on geographies consisting of 553,973,696 people shows no correlation between the proportion of Dutch and percentage of population with ambulatory disability in the United States with a correlation coefficient (R) of -0.038 and weighted average of 6.4%, a difference of 5.9%.
Ambulatory Disability Correlation Summary
| Measurement | Nicaraguan | Dutch |
| Minimum | 2.0% | 0.40% |
| Maximum | 9.8% | 22.4% |
| Range | 7.8% | 22.0% |
| Mean | 5.8% | 6.5% |
| Median | 5.9% | 6.2% |
| Interquartile 25% (IQ1) | 5.0% | 4.7% |
| Interquartile 75% (IQ3) | 6.4% | 7.1% |
| Interquartile Range (IQR) | 1.4% | 2.4% |
| Standard Deviation (Sample) | 1.5% | 3.4% |
| Standard Deviation (Population) | 1.5% | 3.4% |
Similar Demographics by Ambulatory Disability
Demographics Similar to Nicaraguans by Ambulatory Disability
In terms of ambulatory disability, the demographic groups most similar to Nicaraguans are Iraqi (6.1%, a difference of 0.020%), Basque (6.1%, a difference of 0.030%), Immigrants from Oceania (6.1%, a difference of 0.14%), Ecuadorian (6.1%, a difference of 0.15%), and Lebanese (6.1%, a difference of 0.18%).
| Demographics | Rating | Rank | Ambulatory Disability |
| Immigrants | Fiji | 71.2 /100 | #158 | Good 6.0% |
| Immigrants | Latvia | 71.1 /100 | #159 | Good 6.0% |
| Central Americans | 69.8 /100 | #160 | Good 6.0% |
| Immigrants | Belarus | 69.2 /100 | #161 | Good 6.1% |
| Nigerians | 67.1 /100 | #162 | Good 6.1% |
| Lebanese | 66.2 /100 | #163 | Good 6.1% |
| Basques | 63.7 /100 | #164 | Good 6.1% |
| Nicaraguans | 63.2 /100 | #165 | Good 6.1% |
| Iraqis | 62.8 /100 | #166 | Good 6.1% |
| Immigrants | Oceania | 60.7 /100 | #167 | Good 6.1% |
| Ecuadorians | 60.5 /100 | #168 | Good 6.1% |
| Immigrants | Southern Europe | 58.1 /100 | #169 | Average 6.1% |
| Immigrants | Ecuador | 53.8 /100 | #170 | Average 6.1% |
| Moroccans | 52.6 /100 | #171 | Average 6.1% |
| Immigrants | Burma/Myanmar | 52.2 /100 | #172 | Average 6.1% |
Demographics Similar to Dutch by Ambulatory Disability
In terms of ambulatory disability, the demographic groups most similar to Dutch are Immigrants from Germany (6.4%, a difference of 0.090%), Haitian (6.4%, a difference of 0.10%), Hispanic or Latino (6.4%, a difference of 0.15%), Senegalese (6.4%, a difference of 0.16%), and Immigrants from Liberia (6.4%, a difference of 0.18%).
| Demographics | Rating | Rank | Ambulatory Disability |
| Czechoslovakians | 3.8 /100 | #229 | Tragic 6.4% |
| Mexicans | 3.5 /100 | #230 | Tragic 6.4% |
| Panamanians | 3.1 /100 | #231 | Tragic 6.4% |
| Assyrians/Chaldeans/Syriacs | 2.4 /100 | #232 | Tragic 6.4% |
| Sub-Saharan Africans | 2.3 /100 | #233 | Tragic 6.4% |
| Immigrants | Liberia | 2.3 /100 | #234 | Tragic 6.4% |
| Hispanics or Latinos | 2.2 /100 | #235 | Tragic 6.4% |
| Dutch | 2.0 /100 | #236 | Tragic 6.4% |
| Immigrants | Germany | 1.8 /100 | #237 | Tragic 6.4% |
| Haitians | 1.8 /100 | #238 | Tragic 6.4% |
| Senegalese | 1.7 /100 | #239 | Tragic 6.4% |
| Immigrants | Senegal | 1.7 /100 | #240 | Tragic 6.4% |
| Immigrants | Haiti | 1.6 /100 | #241 | Tragic 6.5% |
| Spaniards | 1.6 /100 | #242 | Tragic 6.5% |
| Germans | 1.5 /100 | #243 | Tragic 6.5% |