Danish vs Comanche In Labor Force | Age 30-34
COMPARE
Danish
Comanche
In Labor Force | Age 30-34
In Labor Force | Age 30-34 Comparison
Danes
Comanche
84.3%
IN LABOR FORCE | AGE 30-34
5.3/ 100
METRIC RATING
220th/ 347
METRIC RANK
82.6%
IN LABOR FORCE | AGE 30-34
0.0/ 100
METRIC RATING
297th/ 347
METRIC RANK
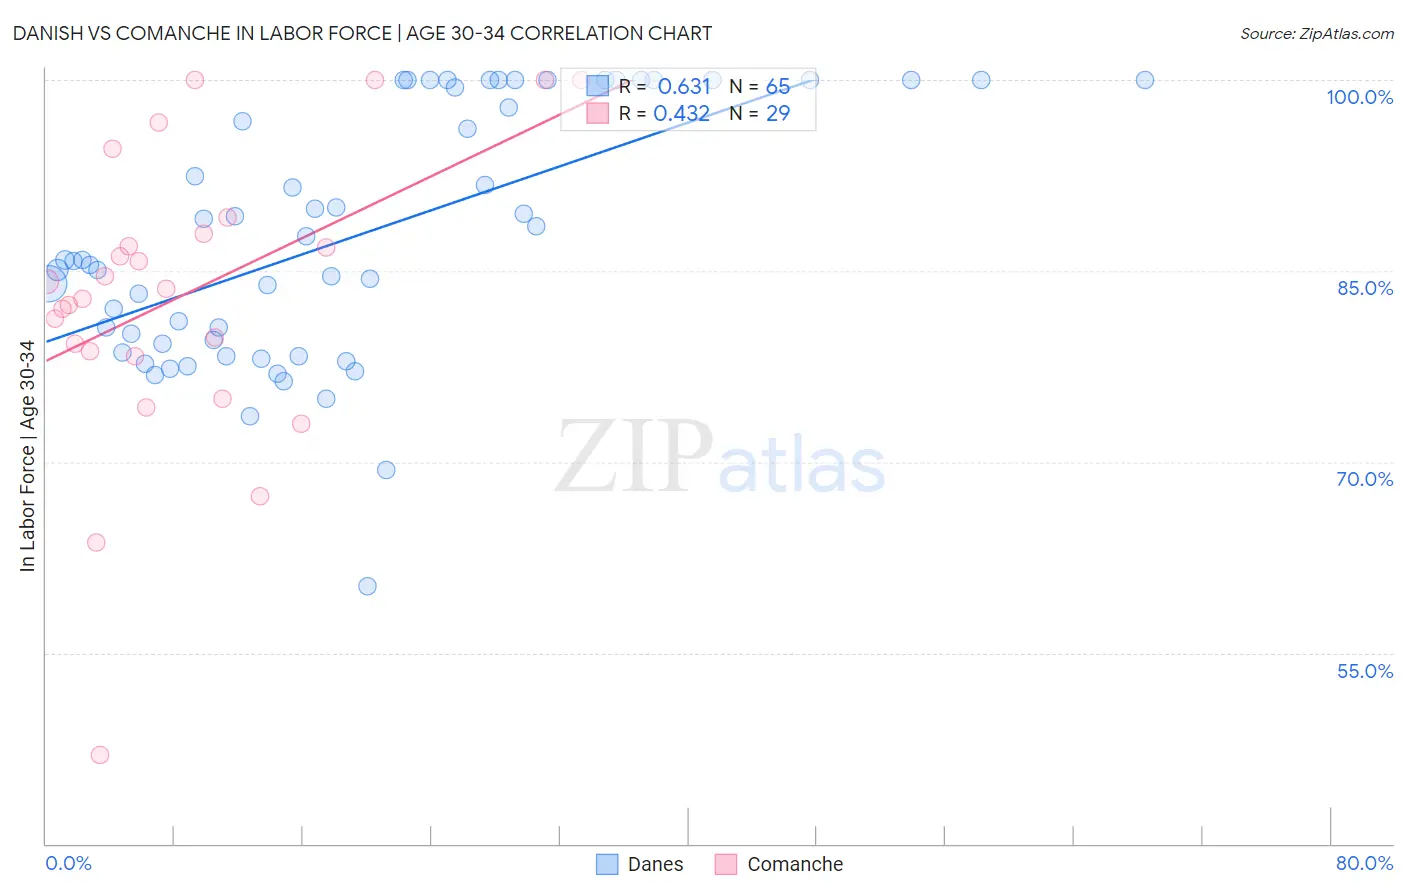
Danish vs Comanche In Labor Force | Age 30-34 Correlation Chart
The statistical analysis conducted on geographies consisting of 473,662,566 people shows a significant positive correlation between the proportion of Danes and labor force participation rate among population between the ages 30 and 34 in the United States with a correlation coefficient (R) of 0.631 and weighted average of 84.3%. Similarly, the statistical analysis conducted on geographies consisting of 109,766,840 people shows a moderate positive correlation between the proportion of Comanche and labor force participation rate among population between the ages 30 and 34 in the United States with a correlation coefficient (R) of 0.432 and weighted average of 82.6%, a difference of 2.0%.
In Labor Force | Age 30-34 Correlation Summary
| Measurement | Danish | Comanche |
| Minimum | 60.2% | 46.9% |
| Maximum | 100.0% | 100.0% |
| Range | 39.8% | 53.1% |
| Mean | 87.6% | 83.1% |
| Median | 85.8% | 83.6% |
| Interquartile 25% (IQ1) | 79.0% | 78.5% |
| Interquartile 75% (IQ3) | 100.0% | 88.5% |
| Interquartile Range (IQR) | 21.0% | 10.0% |
| Standard Deviation (Sample) | 9.8% | 11.7% |
| Standard Deviation (Population) | 9.8% | 11.5% |
Similar Demographics by In Labor Force | Age 30-34
Demographics Similar to Danes by In Labor Force | Age 30-34
In terms of in labor force | age 30-34, the demographic groups most similar to Danes are Swiss (84.3%, a difference of 0.020%), Immigrants from Panama (84.3%, a difference of 0.030%), Immigrants from Trinidad and Tobago (84.3%, a difference of 0.050%), Immigrants from Germany (84.3%, a difference of 0.060%), and European (84.3%, a difference of 0.060%).
| Demographics | Rating | Rank | In Labor Force | Age 30-34 |
| Immigrants | Jamaica | 7.9 /100 | #213 | Tragic 84.3% |
| Immigrants | Germany | 7.2 /100 | #214 | Tragic 84.3% |
| Europeans | 7.2 /100 | #215 | Tragic 84.3% |
| Immigrants | Ecuador | 7.1 /100 | #216 | Tragic 84.3% |
| Immigrants | Trinidad and Tobago | 7.0 /100 | #217 | Tragic 84.3% |
| Immigrants | Panama | 6.3 /100 | #218 | Tragic 84.3% |
| Swiss | 5.8 /100 | #219 | Tragic 84.3% |
| Danes | 5.3 /100 | #220 | Tragic 84.3% |
| Salvadorans | 3.8 /100 | #221 | Tragic 84.2% |
| Panamanians | 3.8 /100 | #222 | Tragic 84.2% |
| Immigrants | Laos | 3.6 /100 | #223 | Tragic 84.2% |
| Cubans | 3.4 /100 | #224 | Tragic 84.2% |
| Scottish | 3.1 /100 | #225 | Tragic 84.2% |
| Immigrants | El Salvador | 3.0 /100 | #226 | Tragic 84.2% |
| Immigrants | Cuba | 3.0 /100 | #227 | Tragic 84.2% |
Demographics Similar to Comanche by In Labor Force | Age 30-34
In terms of in labor force | age 30-34, the demographic groups most similar to Comanche are Aleut (82.6%, a difference of 0.0%), Chippewa (82.6%, a difference of 0.010%), Pennsylvania German (82.6%, a difference of 0.030%), Immigrants from Central America (82.5%, a difference of 0.13%), and American (82.7%, a difference of 0.15%).
| Demographics | Rating | Rank | In Labor Force | Age 30-34 |
| Blackfeet | 0.0 /100 | #290 | Tragic 82.8% |
| Potawatomi | 0.0 /100 | #291 | Tragic 82.8% |
| Blacks/African Americans | 0.0 /100 | #292 | Tragic 82.8% |
| Nepalese | 0.0 /100 | #293 | Tragic 82.7% |
| Americans | 0.0 /100 | #294 | Tragic 82.7% |
| Pennsylvania Germans | 0.0 /100 | #295 | Tragic 82.6% |
| Chippewa | 0.0 /100 | #296 | Tragic 82.6% |
| Comanche | 0.0 /100 | #297 | Tragic 82.6% |
| Aleuts | 0.0 /100 | #298 | Tragic 82.6% |
| Immigrants | Central America | 0.0 /100 | #299 | Tragic 82.5% |
| Hmong | 0.0 /100 | #300 | Tragic 82.4% |
| Hispanics or Latinos | 0.0 /100 | #301 | Tragic 82.4% |
| Ottawa | 0.0 /100 | #302 | Tragic 82.4% |
| Immigrants | Micronesia | 0.0 /100 | #303 | Tragic 82.4% |
| Tlingit-Haida | 0.0 /100 | #304 | Tragic 82.3% |