Panamanian vs German Hearing Disability
COMPARE
Panamanian
German
Hearing Disability
Hearing Disability Comparison
Panamanians
Germans
3.0%
HEARING DISABILITY
47.0/ 100
METRIC RATING
176th/ 347
METRIC RANK
3.7%
HEARING DISABILITY
0.0/ 100
METRIC RATING
299th/ 347
METRIC RANK
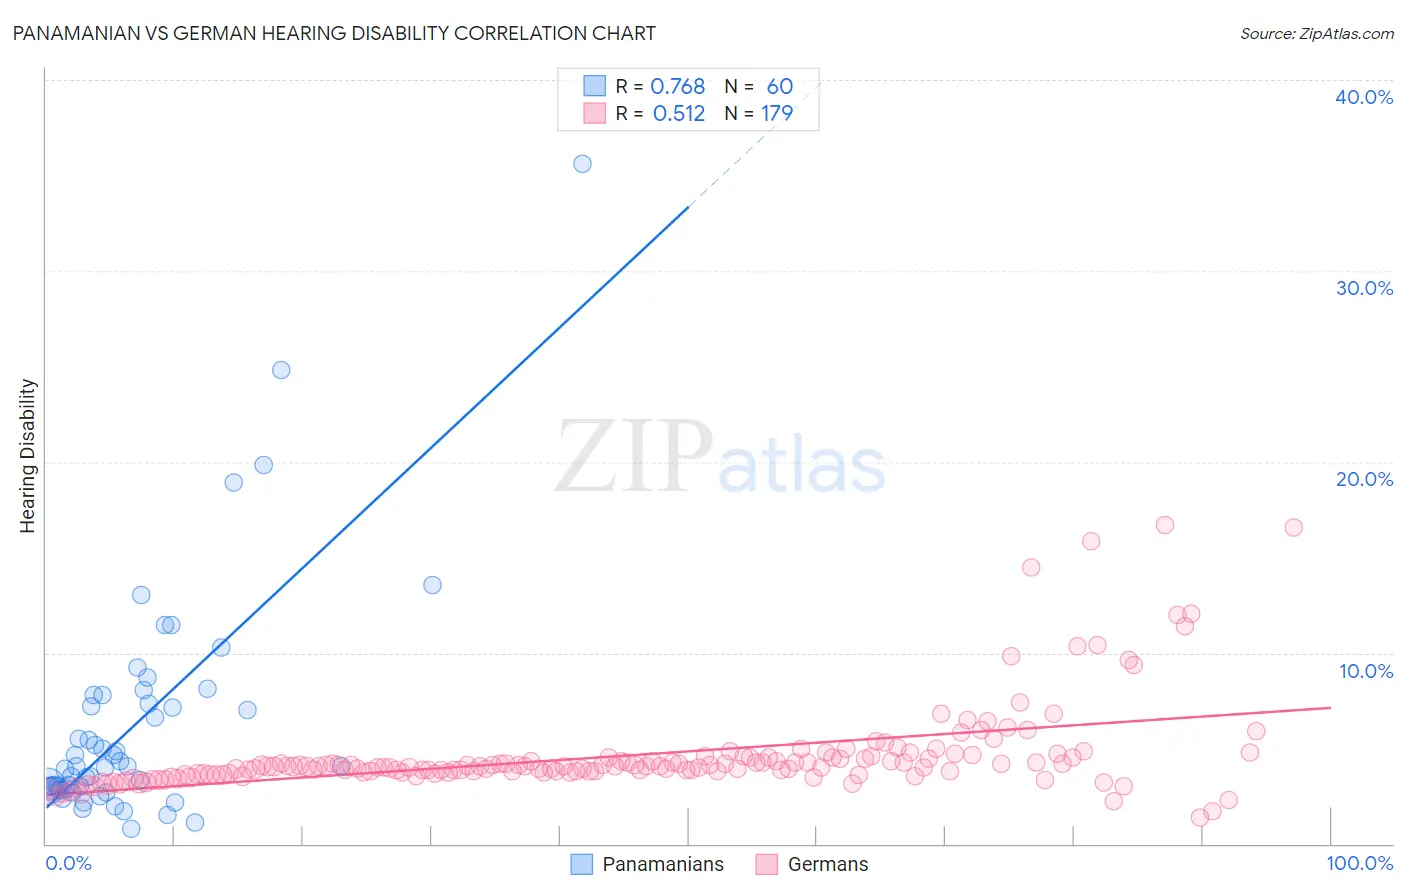
Panamanian vs German Hearing Disability Correlation Chart
The statistical analysis conducted on geographies consisting of 281,114,071 people shows a strong positive correlation between the proportion of Panamanians and percentage of population with hearing disability in the United States with a correlation coefficient (R) of 0.768 and weighted average of 3.0%. Similarly, the statistical analysis conducted on geographies consisting of 580,131,605 people shows a substantial positive correlation between the proportion of Germans and percentage of population with hearing disability in the United States with a correlation coefficient (R) of 0.512 and weighted average of 3.7%, a difference of 24.3%.
Hearing Disability Correlation Summary
| Measurement | Panamanian | German |
| Minimum | 0.76% | 1.4% |
| Maximum | 35.6% | 16.7% |
| Range | 34.9% | 15.3% |
| Mean | 6.2% | 4.6% |
| Median | 4.0% | 4.1% |
| Interquartile 25% (IQ1) | 2.9% | 3.7% |
| Interquartile 75% (IQ3) | 7.6% | 4.5% |
| Interquartile Range (IQR) | 4.7% | 0.75% |
| Standard Deviation (Sample) | 6.1% | 2.3% |
| Standard Deviation (Population) | 6.0% | 2.3% |
Similar Demographics by Hearing Disability
Demographics Similar to Panamanians by Hearing Disability
In terms of hearing disability, the demographic groups most similar to Panamanians are Immigrants from Philippines (3.0%, a difference of 0.060%), Japanese (3.0%, a difference of 0.10%), Immigrants from Romania (3.0%, a difference of 0.14%), Indonesian (3.0%, a difference of 0.28%), and Immigrants from Moldova (3.0%, a difference of 0.37%).
| Demographics | Rating | Rank | Hearing Disability |
| Arabs | 57.6 /100 | #169 | Average 3.0% |
| Immigrants | Cabo Verde | 56.9 /100 | #170 | Average 3.0% |
| Immigrants | Ukraine | 56.6 /100 | #171 | Average 3.0% |
| Armenians | 56.0 /100 | #172 | Average 3.0% |
| Immigrants | Serbia | 51.1 /100 | #173 | Average 3.0% |
| Indonesians | 50.0 /100 | #174 | Average 3.0% |
| Immigrants | Romania | 48.4 /100 | #175 | Average 3.0% |
| Panamanians | 47.0 /100 | #176 | Average 3.0% |
| Immigrants | Philippines | 46.4 /100 | #177 | Average 3.0% |
| Japanese | 46.0 /100 | #178 | Average 3.0% |
| Immigrants | Moldova | 43.1 /100 | #179 | Average 3.0% |
| Immigrants | Sweden | 42.4 /100 | #180 | Average 3.0% |
| Immigrants | Belgium | 41.5 /100 | #181 | Average 3.0% |
| Immigrants | Italy | 41.1 /100 | #182 | Average 3.0% |
| Bulgarians | 39.7 /100 | #183 | Fair 3.0% |
Demographics Similar to Germans by Hearing Disability
In terms of hearing disability, the demographic groups most similar to Germans are Scottish (3.7%, a difference of 0.060%), Pennsylvania German (3.7%, a difference of 0.090%), Dutch (3.7%, a difference of 0.20%), Menominee (3.7%, a difference of 0.25%), and Celtic (3.7%, a difference of 0.28%).
| Demographics | Rating | Rank | Hearing Disability |
| Native Hawaiians | 0.0 /100 | #292 | Tragic 3.7% |
| Norwegians | 0.0 /100 | #293 | Tragic 3.7% |
| Iroquois | 0.0 /100 | #294 | Tragic 3.7% |
| Welsh | 0.0 /100 | #295 | Tragic 3.7% |
| Pima | 0.0 /100 | #296 | Tragic 3.7% |
| Immigrants | Azores | 0.0 /100 | #297 | Tragic 3.7% |
| Celtics | 0.0 /100 | #298 | Tragic 3.7% |
| Germans | 0.0 /100 | #299 | Tragic 3.7% |
| Scottish | 0.0 /100 | #300 | Tragic 3.7% |
| Pennsylvania Germans | 0.0 /100 | #301 | Tragic 3.7% |
| Dutch | 0.0 /100 | #302 | Tragic 3.7% |
| Menominee | 0.0 /100 | #303 | Tragic 3.7% |
| French | 0.0 /100 | #304 | Tragic 3.8% |
| English | 0.0 /100 | #305 | Tragic 3.8% |
| Marshallese | 0.0 /100 | #306 | Tragic 3.8% |