Czechoslovakian vs South American Cognitive Disability
COMPARE
Czechoslovakian
South American
Cognitive Disability
Cognitive Disability Comparison
Czechoslovakians
South Americans
16.6%
COGNITIVE DISABILITY
99.6/ 100
METRIC RATING
62nd/ 347
METRIC RANK
16.7%
COGNITIVE DISABILITY
98.8/ 100
METRIC RATING
90th/ 347
METRIC RANK
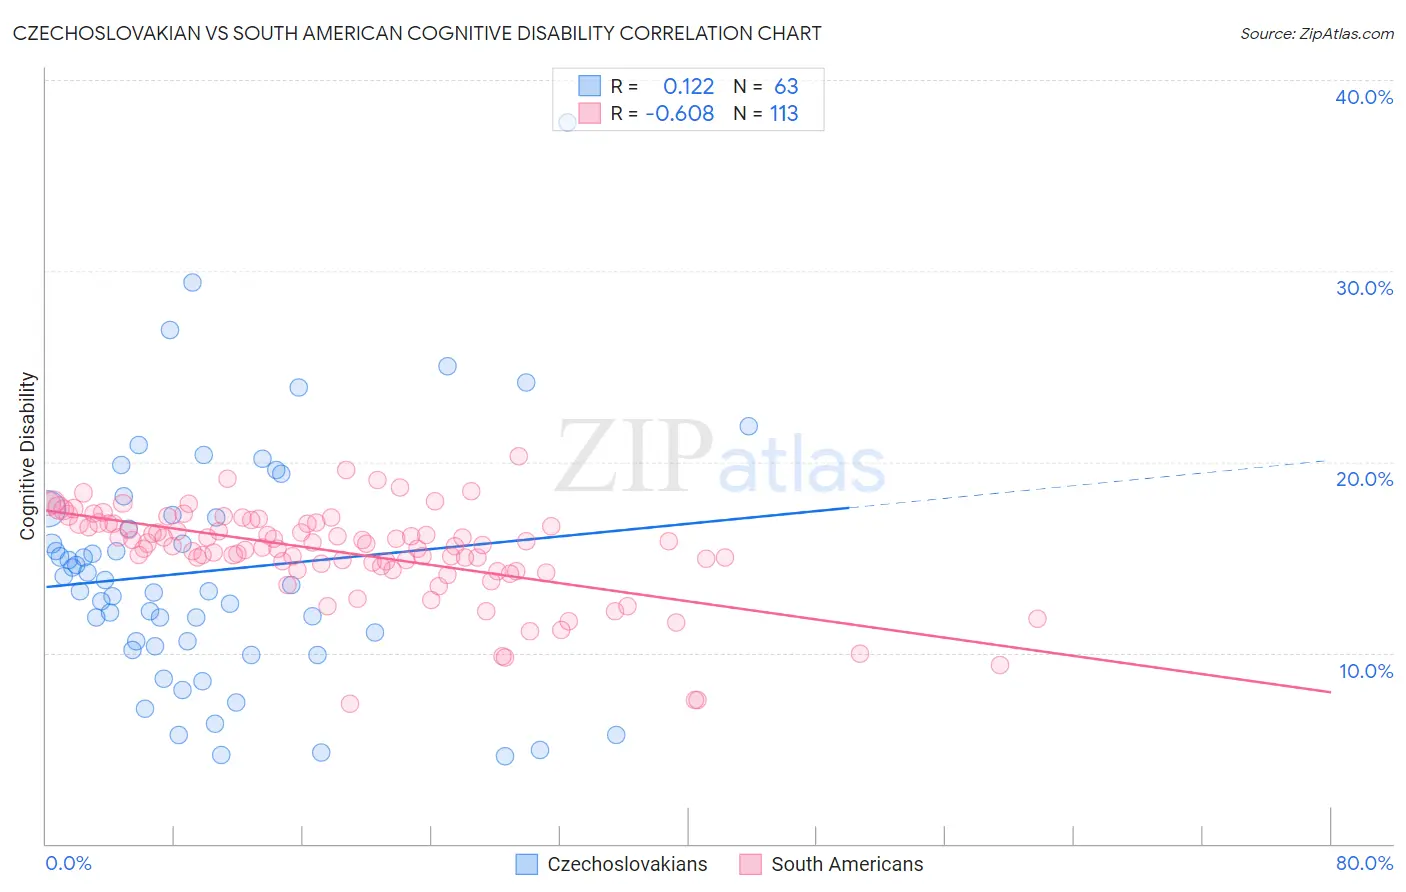
Czechoslovakian vs South American Cognitive Disability Correlation Chart
The statistical analysis conducted on geographies consisting of 368,659,789 people shows a poor positive correlation between the proportion of Czechoslovakians and percentage of population with cognitive disability in the United States with a correlation coefficient (R) of 0.122 and weighted average of 16.6%. Similarly, the statistical analysis conducted on geographies consisting of 494,074,477 people shows a significant negative correlation between the proportion of South Americans and percentage of population with cognitive disability in the United States with a correlation coefficient (R) of -0.608 and weighted average of 16.7%, a difference of 0.86%.
Cognitive Disability Correlation Summary
| Measurement | Czechoslovakian | South American |
| Minimum | 4.6% | 7.3% |
| Maximum | 37.8% | 20.3% |
| Range | 33.2% | 12.9% |
| Mean | 14.3% | 15.2% |
| Median | 13.6% | 15.6% |
| Interquartile 25% (IQ1) | 10.4% | 14.5% |
| Interquartile 75% (IQ3) | 17.2% | 16.8% |
| Interquartile Range (IQR) | 6.9% | 2.3% |
| Standard Deviation (Sample) | 6.3% | 2.4% |
| Standard Deviation (Population) | 6.3% | 2.4% |
Similar Demographics by Cognitive Disability
Demographics Similar to Czechoslovakians by Cognitive Disability
In terms of cognitive disability, the demographic groups most similar to Czechoslovakians are Argentinean (16.6%, a difference of 0.020%), Immigrants from England (16.6%, a difference of 0.030%), Venezuelan (16.6%, a difference of 0.080%), Romanian (16.6%, a difference of 0.090%), and Pennsylvania German (16.6%, a difference of 0.10%).
| Demographics | Rating | Rank | Cognitive Disability |
| Immigrants | Venezuela | 99.7 /100 | #55 | Exceptional 16.5% |
| Austrians | 99.7 /100 | #56 | Exceptional 16.6% |
| Bhutanese | 99.7 /100 | #57 | Exceptional 16.6% |
| Pennsylvania Germans | 99.7 /100 | #58 | Exceptional 16.6% |
| Immigrants | Peru | 99.7 /100 | #59 | Exceptional 16.6% |
| Romanians | 99.7 /100 | #60 | Exceptional 16.6% |
| Immigrants | England | 99.6 /100 | #61 | Exceptional 16.6% |
| Czechoslovakians | 99.6 /100 | #62 | Exceptional 16.6% |
| Argentineans | 99.6 /100 | #63 | Exceptional 16.6% |
| Venezuelans | 99.6 /100 | #64 | Exceptional 16.6% |
| Colombians | 99.6 /100 | #65 | Exceptional 16.6% |
| Immigrants | Ukraine | 99.5 /100 | #66 | Exceptional 16.6% |
| Latvians | 99.5 /100 | #67 | Exceptional 16.6% |
| Ukrainians | 99.4 /100 | #68 | Exceptional 16.6% |
| Immigrants | Uzbekistan | 99.4 /100 | #69 | Exceptional 16.7% |
Demographics Similar to South Americans by Cognitive Disability
In terms of cognitive disability, the demographic groups most similar to South Americans are Immigrants from Egypt (16.7%, a difference of 0.0%), Danish (16.7%, a difference of 0.010%), Immigrants from South America (16.7%, a difference of 0.020%), Immigrants from Southern Europe (16.7%, a difference of 0.020%), and Asian (16.7%, a difference of 0.070%).
| Demographics | Rating | Rank | Cognitive Disability |
| Serbians | 99.1 /100 | #83 | Exceptional 16.7% |
| Belgians | 99.1 /100 | #84 | Exceptional 16.7% |
| Immigrants | Moldova | 99.1 /100 | #85 | Exceptional 16.7% |
| Immigrants | South Africa | 99.0 /100 | #86 | Exceptional 16.7% |
| Native Hawaiians | 99.0 /100 | #87 | Exceptional 16.7% |
| Immigrants | Philippines | 99.0 /100 | #88 | Exceptional 16.7% |
| Immigrants | Egypt | 98.8 /100 | #89 | Exceptional 16.7% |
| South Americans | 98.8 /100 | #90 | Exceptional 16.7% |
| Danes | 98.8 /100 | #91 | Exceptional 16.7% |
| Immigrants | South America | 98.8 /100 | #92 | Exceptional 16.7% |
| Immigrants | Southern Europe | 98.7 /100 | #93 | Exceptional 16.7% |
| Asians | 98.7 /100 | #94 | Exceptional 16.7% |
| English | 98.6 /100 | #95 | Exceptional 16.8% |
| Finns | 98.5 /100 | #96 | Exceptional 16.8% |
| Dutch | 98.5 /100 | #97 | Exceptional 16.8% |