Czechoslovakian vs Ute Cognitive Disability
COMPARE
Czechoslovakian
Ute
Cognitive Disability
Cognitive Disability Comparison
Czechoslovakians
Ute
16.6%
COGNITIVE DISABILITY
99.6/ 100
METRIC RATING
62nd/ 347
METRIC RANK
17.3%
COGNITIVE DISABILITY
49.1/ 100
METRIC RATING
177th/ 347
METRIC RANK
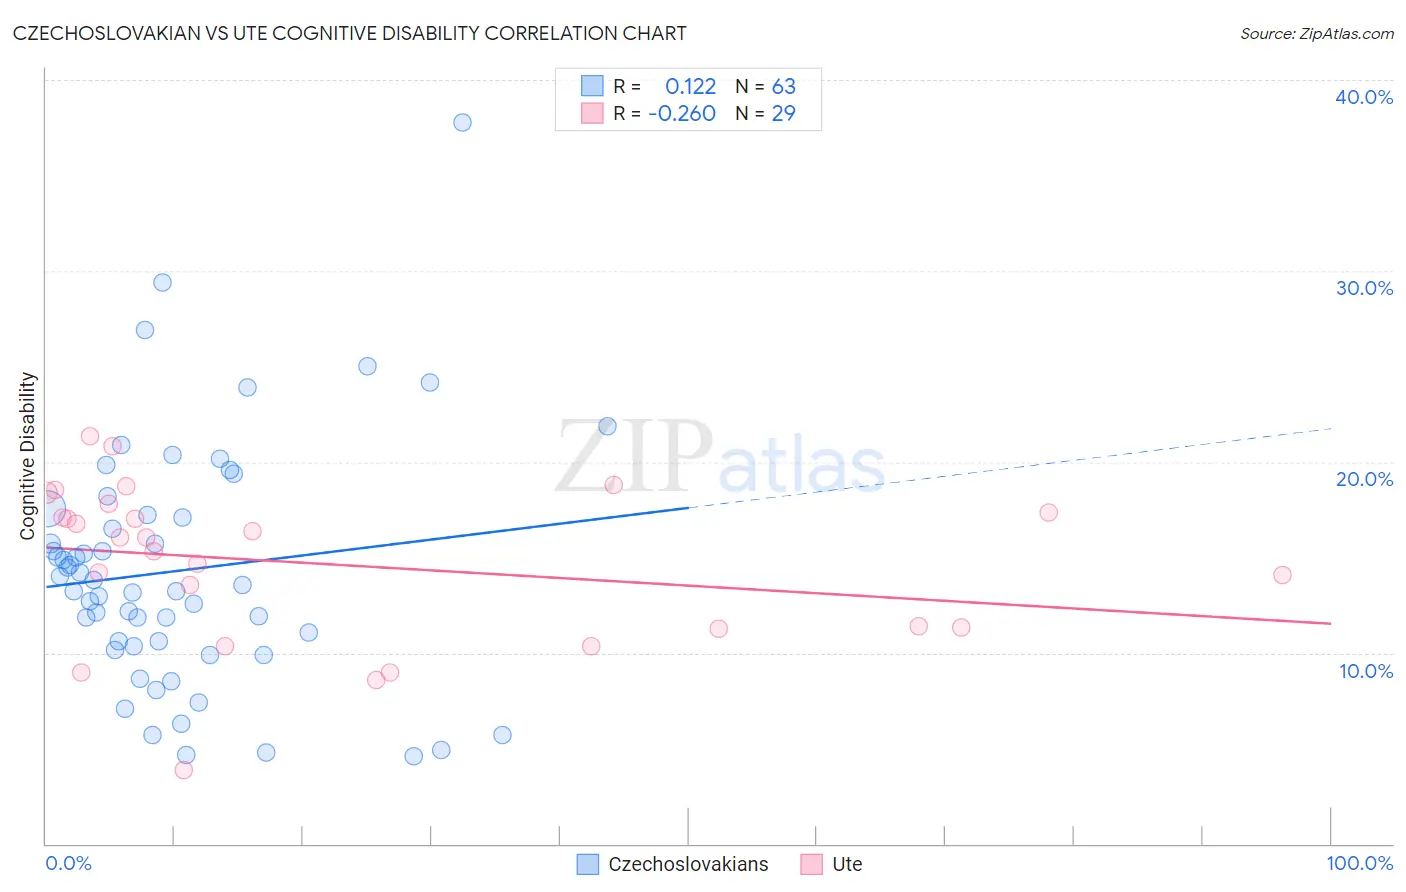
Czechoslovakian vs Ute Cognitive Disability Correlation Chart
The statistical analysis conducted on geographies consisting of 368,659,789 people shows a poor positive correlation between the proportion of Czechoslovakians and percentage of population with cognitive disability in the United States with a correlation coefficient (R) of 0.122 and weighted average of 16.6%. Similarly, the statistical analysis conducted on geographies consisting of 55,658,356 people shows a weak negative correlation between the proportion of Ute and percentage of population with cognitive disability in the United States with a correlation coefficient (R) of -0.260 and weighted average of 17.3%, a difference of 4.1%.
Cognitive Disability Correlation Summary
| Measurement | Czechoslovakian | Ute |
| Minimum | 4.6% | 3.9% |
| Maximum | 37.8% | 21.4% |
| Range | 33.2% | 17.5% |
| Mean | 14.3% | 14.6% |
| Median | 13.6% | 16.0% |
| Interquartile 25% (IQ1) | 10.4% | 11.3% |
| Interquartile 75% (IQ3) | 17.2% | 17.6% |
| Interquartile Range (IQR) | 6.9% | 6.3% |
| Standard Deviation (Sample) | 6.3% | 4.1% |
| Standard Deviation (Population) | 6.3% | 4.1% |
Similar Demographics by Cognitive Disability
Demographics Similar to Czechoslovakians by Cognitive Disability
In terms of cognitive disability, the demographic groups most similar to Czechoslovakians are Argentinean (16.6%, a difference of 0.020%), Immigrants from England (16.6%, a difference of 0.030%), Venezuelan (16.6%, a difference of 0.080%), Romanian (16.6%, a difference of 0.090%), and Pennsylvania German (16.6%, a difference of 0.10%).
| Demographics | Rating | Rank | Cognitive Disability |
| Immigrants | Venezuela | 99.7 /100 | #55 | Exceptional 16.5% |
| Austrians | 99.7 /100 | #56 | Exceptional 16.6% |
| Bhutanese | 99.7 /100 | #57 | Exceptional 16.6% |
| Pennsylvania Germans | 99.7 /100 | #58 | Exceptional 16.6% |
| Immigrants | Peru | 99.7 /100 | #59 | Exceptional 16.6% |
| Romanians | 99.7 /100 | #60 | Exceptional 16.6% |
| Immigrants | England | 99.6 /100 | #61 | Exceptional 16.6% |
| Czechoslovakians | 99.6 /100 | #62 | Exceptional 16.6% |
| Argentineans | 99.6 /100 | #63 | Exceptional 16.6% |
| Venezuelans | 99.6 /100 | #64 | Exceptional 16.6% |
| Colombians | 99.6 /100 | #65 | Exceptional 16.6% |
| Immigrants | Ukraine | 99.5 /100 | #66 | Exceptional 16.6% |
| Latvians | 99.5 /100 | #67 | Exceptional 16.6% |
| Ukrainians | 99.4 /100 | #68 | Exceptional 16.6% |
| Immigrants | Uzbekistan | 99.4 /100 | #69 | Exceptional 16.7% |
Demographics Similar to Ute by Cognitive Disability
In terms of cognitive disability, the demographic groups most similar to Ute are Shoshone (17.3%, a difference of 0.0%), Spanish (17.3%, a difference of 0.0%), Sioux (17.3%, a difference of 0.010%), Tsimshian (17.3%, a difference of 0.020%), and Immigrants from Northern Africa (17.3%, a difference of 0.030%).
| Demographics | Rating | Rank | Cognitive Disability |
| Ecuadorians | 59.6 /100 | #170 | Average 17.2% |
| Tlingit-Haida | 59.4 /100 | #171 | Average 17.2% |
| Immigrants | Turkey | 56.7 /100 | #172 | Average 17.2% |
| Immigrants | Northern Africa | 50.2 /100 | #173 | Average 17.3% |
| Laotians | 50.0 /100 | #174 | Average 17.3% |
| Tsimshian | 49.8 /100 | #175 | Average 17.3% |
| Shoshone | 49.2 /100 | #176 | Average 17.3% |
| Ute | 49.1 /100 | #177 | Average 17.3% |
| Spanish | 48.9 /100 | #178 | Average 17.3% |
| Sioux | 48.6 /100 | #179 | Average 17.3% |
| Pakistanis | 43.9 /100 | #180 | Average 17.3% |
| Immigrants | Guyana | 42.9 /100 | #181 | Average 17.3% |
| Arabs | 42.8 /100 | #182 | Average 17.3% |
| Spaniards | 40.3 /100 | #183 | Average 17.3% |
| Crow | 39.1 /100 | #184 | Fair 17.3% |