U.S. Virgin Islander vs South American Cognitive Disability
COMPARE
U.S. Virgin Islander
South American
Cognitive Disability
Cognitive Disability Comparison
U.S. Virgin Islanders
South Americans
18.7%
COGNITIVE DISABILITY
0.0/ 100
METRIC RATING
327th/ 347
METRIC RANK
16.7%
COGNITIVE DISABILITY
98.8/ 100
METRIC RATING
90th/ 347
METRIC RANK
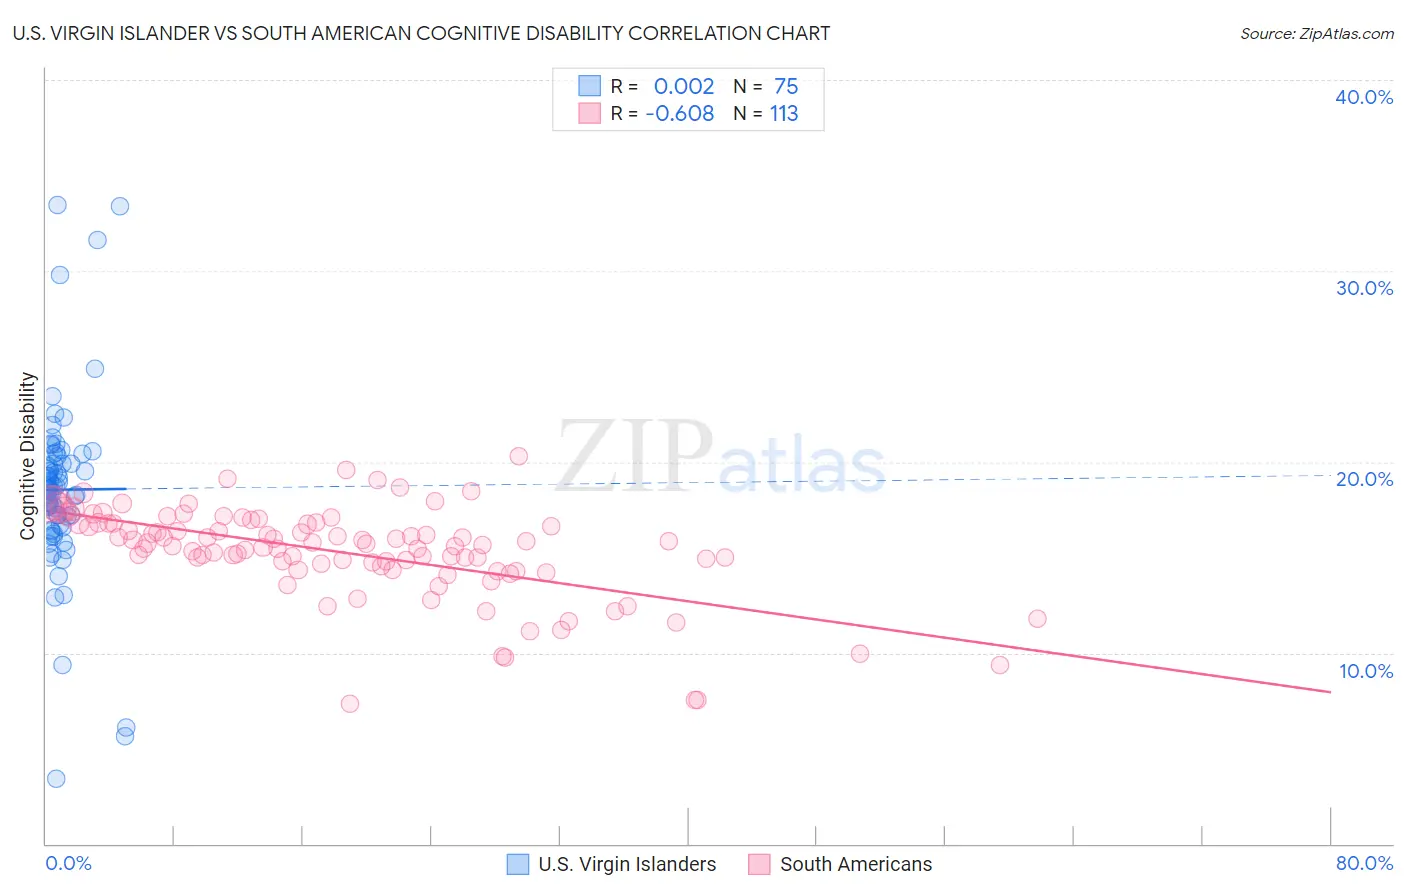
U.S. Virgin Islander vs South American Cognitive Disability Correlation Chart
The statistical analysis conducted on geographies consisting of 87,523,462 people shows no correlation between the proportion of U.S. Virgin Islanders and percentage of population with cognitive disability in the United States with a correlation coefficient (R) of 0.002 and weighted average of 18.7%. Similarly, the statistical analysis conducted on geographies consisting of 494,074,477 people shows a significant negative correlation between the proportion of South Americans and percentage of population with cognitive disability in the United States with a correlation coefficient (R) of -0.608 and weighted average of 16.7%, a difference of 11.8%.
Cognitive Disability Correlation Summary
| Measurement | U.S. Virgin Islander | South American |
| Minimum | 3.4% | 7.3% |
| Maximum | 33.5% | 20.3% |
| Range | 30.0% | 12.9% |
| Mean | 18.5% | 15.2% |
| Median | 18.6% | 15.6% |
| Interquartile 25% (IQ1) | 16.6% | 14.5% |
| Interquartile 75% (IQ3) | 20.3% | 16.8% |
| Interquartile Range (IQR) | 3.7% | 2.3% |
| Standard Deviation (Sample) | 4.8% | 2.4% |
| Standard Deviation (Population) | 4.8% | 2.4% |
Similar Demographics by Cognitive Disability
Demographics Similar to U.S. Virgin Islanders by Cognitive Disability
In terms of cognitive disability, the demographic groups most similar to U.S. Virgin Islanders are Immigrants from Senegal (18.7%, a difference of 0.040%), Indonesian (18.7%, a difference of 0.060%), Kiowa (18.7%, a difference of 0.060%), Dominican (18.7%, a difference of 0.14%), and Pueblo (18.7%, a difference of 0.26%).
| Demographics | Rating | Rank | Cognitive Disability |
| Apache | 0.0 /100 | #320 | Tragic 18.6% |
| Africans | 0.0 /100 | #321 | Tragic 18.6% |
| Immigrants | Liberia | 0.0 /100 | #322 | Tragic 18.7% |
| Pueblo | 0.0 /100 | #323 | Tragic 18.7% |
| Dominicans | 0.0 /100 | #324 | Tragic 18.7% |
| Indonesians | 0.0 /100 | #325 | Tragic 18.7% |
| Immigrants | Senegal | 0.0 /100 | #326 | Tragic 18.7% |
| U.S. Virgin Islanders | 0.0 /100 | #327 | Tragic 18.7% |
| Kiowa | 0.0 /100 | #328 | Tragic 18.7% |
| Navajo | 0.0 /100 | #329 | Tragic 18.8% |
| Immigrants | Dominican Republic | 0.0 /100 | #330 | Tragic 18.8% |
| Pima | 0.0 /100 | #331 | Tragic 18.8% |
| Immigrants | Sudan | 0.0 /100 | #332 | Tragic 18.8% |
| Immigrants | Yemen | 0.0 /100 | #333 | Tragic 18.8% |
| Sudanese | 0.0 /100 | #334 | Tragic 18.9% |
Demographics Similar to South Americans by Cognitive Disability
In terms of cognitive disability, the demographic groups most similar to South Americans are Immigrants from Egypt (16.7%, a difference of 0.0%), Danish (16.7%, a difference of 0.010%), Immigrants from South America (16.7%, a difference of 0.020%), Immigrants from Southern Europe (16.7%, a difference of 0.020%), and Asian (16.7%, a difference of 0.070%).
| Demographics | Rating | Rank | Cognitive Disability |
| Serbians | 99.1 /100 | #83 | Exceptional 16.7% |
| Belgians | 99.1 /100 | #84 | Exceptional 16.7% |
| Immigrants | Moldova | 99.1 /100 | #85 | Exceptional 16.7% |
| Immigrants | South Africa | 99.0 /100 | #86 | Exceptional 16.7% |
| Native Hawaiians | 99.0 /100 | #87 | Exceptional 16.7% |
| Immigrants | Philippines | 99.0 /100 | #88 | Exceptional 16.7% |
| Immigrants | Egypt | 98.8 /100 | #89 | Exceptional 16.7% |
| South Americans | 98.8 /100 | #90 | Exceptional 16.7% |
| Danes | 98.8 /100 | #91 | Exceptional 16.7% |
| Immigrants | South America | 98.8 /100 | #92 | Exceptional 16.7% |
| Immigrants | Southern Europe | 98.7 /100 | #93 | Exceptional 16.7% |
| Asians | 98.7 /100 | #94 | Exceptional 16.7% |
| English | 98.6 /100 | #95 | Exceptional 16.8% |
| Finns | 98.5 /100 | #96 | Exceptional 16.8% |
| Dutch | 98.5 /100 | #97 | Exceptional 16.8% |