Czechoslovakian vs South American 5th Grade
COMPARE
Czechoslovakian
South American
5th Grade
5th Grade Comparison
Czechoslovakians
South Americans
98.0%
5TH GRADE
99.9/ 100
METRIC RATING
45th/ 347
METRIC RANK
96.8%
5TH GRADE
0.7/ 100
METRIC RATING
255th/ 347
METRIC RANK
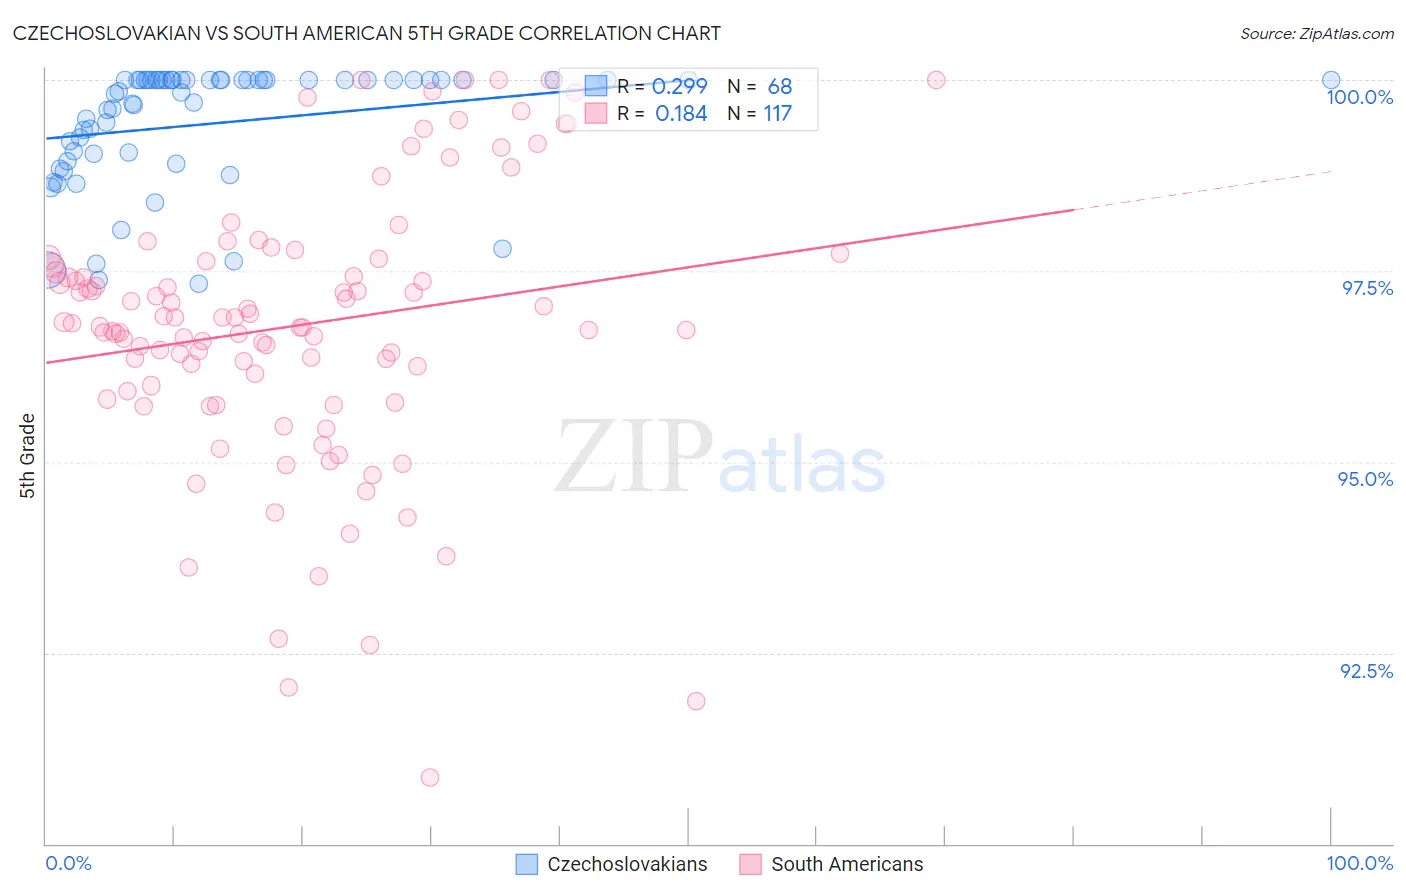
Czechoslovakian vs South American 5th Grade Correlation Chart
The statistical analysis conducted on geographies consisting of 368,657,544 people shows a weak positive correlation between the proportion of Czechoslovakians and percentage of population with at least 5th grade education in the United States with a correlation coefficient (R) of 0.299 and weighted average of 98.0%. Similarly, the statistical analysis conducted on geographies consisting of 494,178,447 people shows a poor positive correlation between the proportion of South Americans and percentage of population with at least 5th grade education in the United States with a correlation coefficient (R) of 0.184 and weighted average of 96.8%, a difference of 1.2%.
5th Grade Correlation Summary
| Measurement | Czechoslovakian | South American |
| Minimum | 97.3% | 90.9% |
| Maximum | 100.0% | 100.0% |
| Range | 2.7% | 9.1% |
| Mean | 99.4% | 96.8% |
| Median | 99.9% | 96.8% |
| Interquartile 25% (IQ1) | 99.0% | 96.0% |
| Interquartile 75% (IQ3) | 100.0% | 97.6% |
| Interquartile Range (IQR) | 1.0% | 1.7% |
| Standard Deviation (Sample) | 0.78% | 1.8% |
| Standard Deviation (Population) | 0.78% | 1.8% |
Similar Demographics by 5th Grade
Demographics Similar to Czechoslovakians by 5th Grade
In terms of 5th grade, the demographic groups most similar to Czechoslovakians are Arapaho (98.0%, a difference of 0.0%), Aleut (98.0%, a difference of 0.010%), Native Hawaiian (98.0%, a difference of 0.010%), Ottawa (98.0%, a difference of 0.020%), and Bulgarian (98.0%, a difference of 0.020%).
| Demographics | Rating | Rank | 5th Grade |
| Belgians | 99.9 /100 | #38 | Exceptional 98.1% |
| Luxembourgers | 99.9 /100 | #39 | Exceptional 98.1% |
| Eastern Europeans | 99.9 /100 | #40 | Exceptional 98.1% |
| Hungarians | 99.9 /100 | #41 | Exceptional 98.0% |
| Northern Europeans | 99.9 /100 | #42 | Exceptional 98.0% |
| Ottawa | 99.9 /100 | #43 | Exceptional 98.0% |
| Aleuts | 99.9 /100 | #44 | Exceptional 98.0% |
| Czechoslovakians | 99.9 /100 | #45 | Exceptional 98.0% |
| Arapaho | 99.9 /100 | #46 | Exceptional 98.0% |
| Native Hawaiians | 99.9 /100 | #47 | Exceptional 98.0% |
| Bulgarians | 99.8 /100 | #48 | Exceptional 98.0% |
| Estonians | 99.8 /100 | #49 | Exceptional 98.0% |
| Immigrants | Scotland | 99.8 /100 | #50 | Exceptional 98.0% |
| Celtics | 99.8 /100 | #51 | Exceptional 98.0% |
| Maltese | 99.8 /100 | #52 | Exceptional 98.0% |
Demographics Similar to South Americans by 5th Grade
In terms of 5th grade, the demographic groups most similar to South Americans are Immigrants from Congo (96.8%, a difference of 0.0%), Peruvian (96.8%, a difference of 0.010%), Immigrants from Middle Africa (96.8%, a difference of 0.020%), Immigrants from Senegal (96.8%, a difference of 0.020%), and Jamaican (96.9%, a difference of 0.030%).
| Demographics | Rating | Rank | 5th Grade |
| U.S. Virgin Islanders | 1.1 /100 | #248 | Tragic 96.9% |
| Immigrants | Uruguay | 1.0 /100 | #249 | Tragic 96.9% |
| Immigrants | Liberia | 1.0 /100 | #250 | Tragic 96.9% |
| Bolivians | 0.9 /100 | #251 | Tragic 96.9% |
| Jamaicans | 0.9 /100 | #252 | Tragic 96.9% |
| Immigrants | Middle Africa | 0.8 /100 | #253 | Tragic 96.8% |
| Immigrants | Senegal | 0.8 /100 | #254 | Tragic 96.8% |
| South Americans | 0.7 /100 | #255 | Tragic 96.8% |
| Immigrants | Congo | 0.7 /100 | #256 | Tragic 96.8% |
| Peruvians | 0.6 /100 | #257 | Tragic 96.8% |
| Immigrants | Ethiopia | 0.5 /100 | #258 | Tragic 96.8% |
| Immigrants | China | 0.5 /100 | #259 | Tragic 96.8% |
| Immigrants | Jamaica | 0.4 /100 | #260 | Tragic 96.8% |
| Immigrants | Sierra Leone | 0.4 /100 | #261 | Tragic 96.8% |
| Immigrants | Colombia | 0.4 /100 | #262 | Tragic 96.8% |