Cuban vs New Zealander Male Disability
COMPARE
Cuban
New Zealander
Male Disability
Male Disability Comparison
Cubans
New Zealanders
11.0%
MALE DISABILITY
74.9/ 100
METRIC RATING
151st/ 347
METRIC RANK
11.2%
MALE DISABILITY
52.9/ 100
METRIC RATING
170th/ 347
METRIC RANK
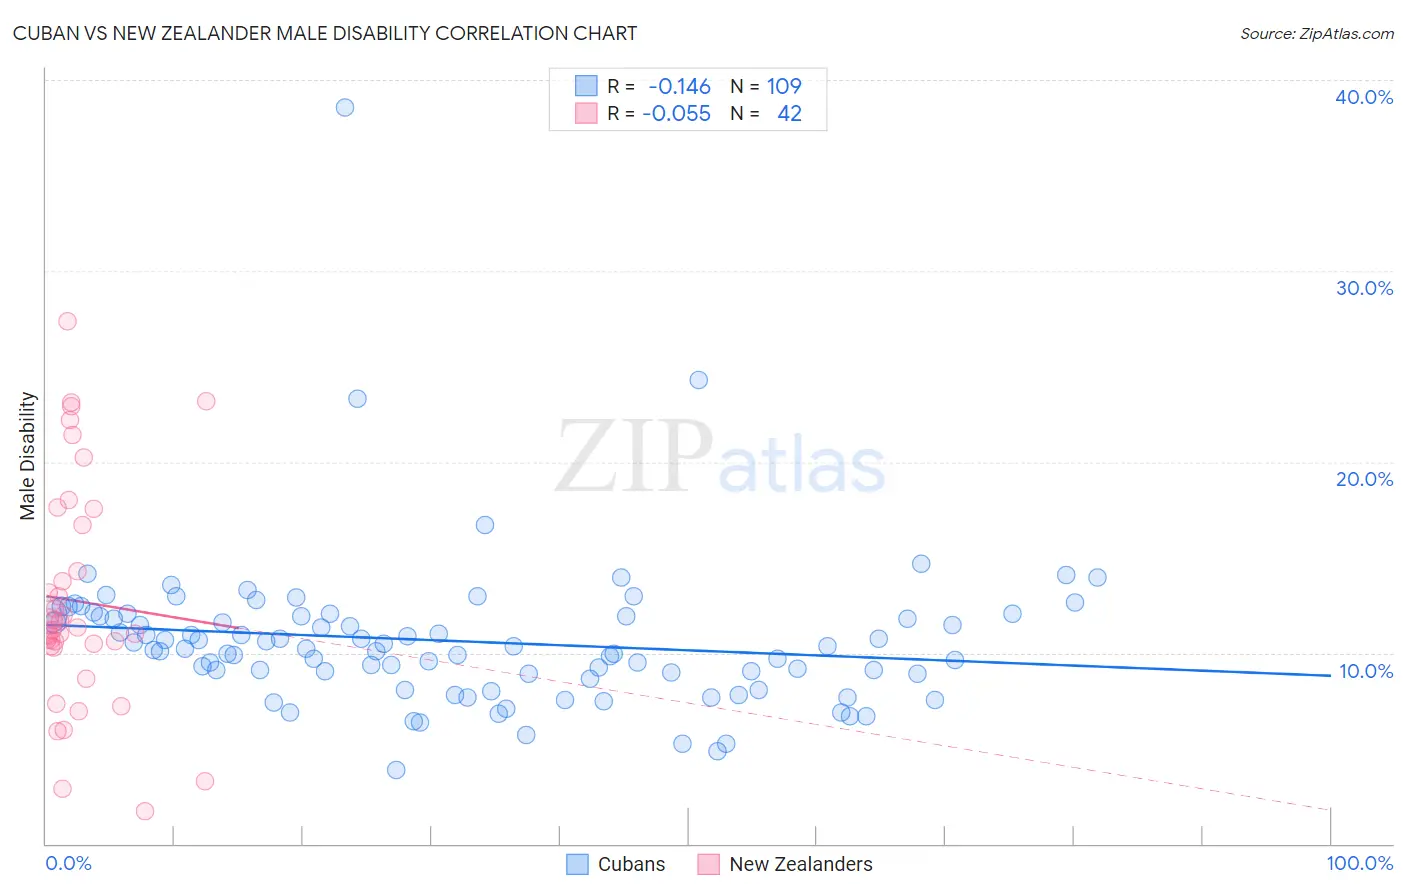
Cuban vs New Zealander Male Disability Correlation Chart
The statistical analysis conducted on geographies consisting of 449,227,297 people shows a poor negative correlation between the proportion of Cubans and percentage of males with a disability in the United States with a correlation coefficient (R) of -0.146 and weighted average of 11.0%. Similarly, the statistical analysis conducted on geographies consisting of 106,918,286 people shows a slight negative correlation between the proportion of New Zealanders and percentage of males with a disability in the United States with a correlation coefficient (R) of -0.055 and weighted average of 11.2%, a difference of 1.4%.
Male Disability Correlation Summary
| Measurement | Cuban | New Zealander |
| Minimum | 3.9% | 1.7% |
| Maximum | 38.6% | 27.4% |
| Range | 34.7% | 25.7% |
| Mean | 10.6% | 12.7% |
| Median | 10.2% | 11.3% |
| Interquartile 25% (IQ1) | 8.9% | 10.4% |
| Interquartile 75% (IQ3) | 11.9% | 16.7% |
| Interquartile Range (IQR) | 3.0% | 6.3% |
| Standard Deviation (Sample) | 4.0% | 5.9% |
| Standard Deviation (Population) | 4.0% | 5.8% |
Demographics Similar to Cubans and New Zealanders by Male Disability
In terms of male disability, the demographic groups most similar to Cubans are Immigrants from Guatemala (11.0%, a difference of 0.020%), Immigrants from Albania (11.0%, a difference of 0.030%), Immigrants from Northern Europe (11.1%, a difference of 0.12%), Immigrants from Moldova (11.1%, a difference of 0.15%), and Immigrants from Middle Africa (11.1%, a difference of 0.28%). Similarly, the demographic groups most similar to New Zealanders are Barbadian (11.2%, a difference of 0.030%), Immigrants from Latin America (11.2%, a difference of 0.060%), Immigrants from Southern Europe (11.2%, a difference of 0.080%), Immigrants from Hungary (11.1%, a difference of 0.47%), and Luxembourger (11.1%, a difference of 0.52%).
| Demographics | Rating | Rank | Male Disability |
| Immigrants | Guatemala | 75.1 /100 | #150 | Good 11.0% |
| Cubans | 74.9 /100 | #151 | Good 11.0% |
| Immigrants | Albania | 74.4 /100 | #152 | Good 11.0% |
| Immigrants | Northern Europe | 73.2 /100 | #153 | Good 11.1% |
| Immigrants | Moldova | 72.8 /100 | #154 | Good 11.1% |
| Immigrants | Middle Africa | 70.9 /100 | #155 | Good 11.1% |
| Russians | 69.8 /100 | #156 | Good 11.1% |
| Immigrants | Western Africa | 69.2 /100 | #157 | Good 11.1% |
| Latvians | 68.1 /100 | #158 | Good 11.1% |
| Guatemalans | 67.2 /100 | #159 | Good 11.1% |
| Albanians | 66.5 /100 | #160 | Good 11.1% |
| Immigrants | West Indies | 65.7 /100 | #161 | Good 11.1% |
| Immigrants | Haiti | 65.3 /100 | #162 | Good 11.1% |
| Immigrants | Kenya | 63.8 /100 | #163 | Good 11.1% |
| British West Indians | 62.8 /100 | #164 | Good 11.1% |
| Luxembourgers | 61.9 /100 | #165 | Good 11.1% |
| Immigrants | Hungary | 61.2 /100 | #166 | Good 11.1% |
| Immigrants | Southern Europe | 54.4 /100 | #167 | Average 11.2% |
| Immigrants | Latin America | 54.0 /100 | #168 | Average 11.2% |
| Barbadians | 53.4 /100 | #169 | Average 11.2% |
| New Zealanders | 52.9 /100 | #170 | Average 11.2% |