Crow vs French Canadian Cognitive Disability
COMPARE
Crow
French Canadian
Cognitive Disability
Cognitive Disability Comparison
Crow
French Canadians
17.3%
COGNITIVE DISABILITY
39.1/ 100
METRIC RATING
184th/ 347
METRIC RANK
17.1%
COGNITIVE DISABILITY
85.7/ 100
METRIC RATING
148th/ 347
METRIC RANK
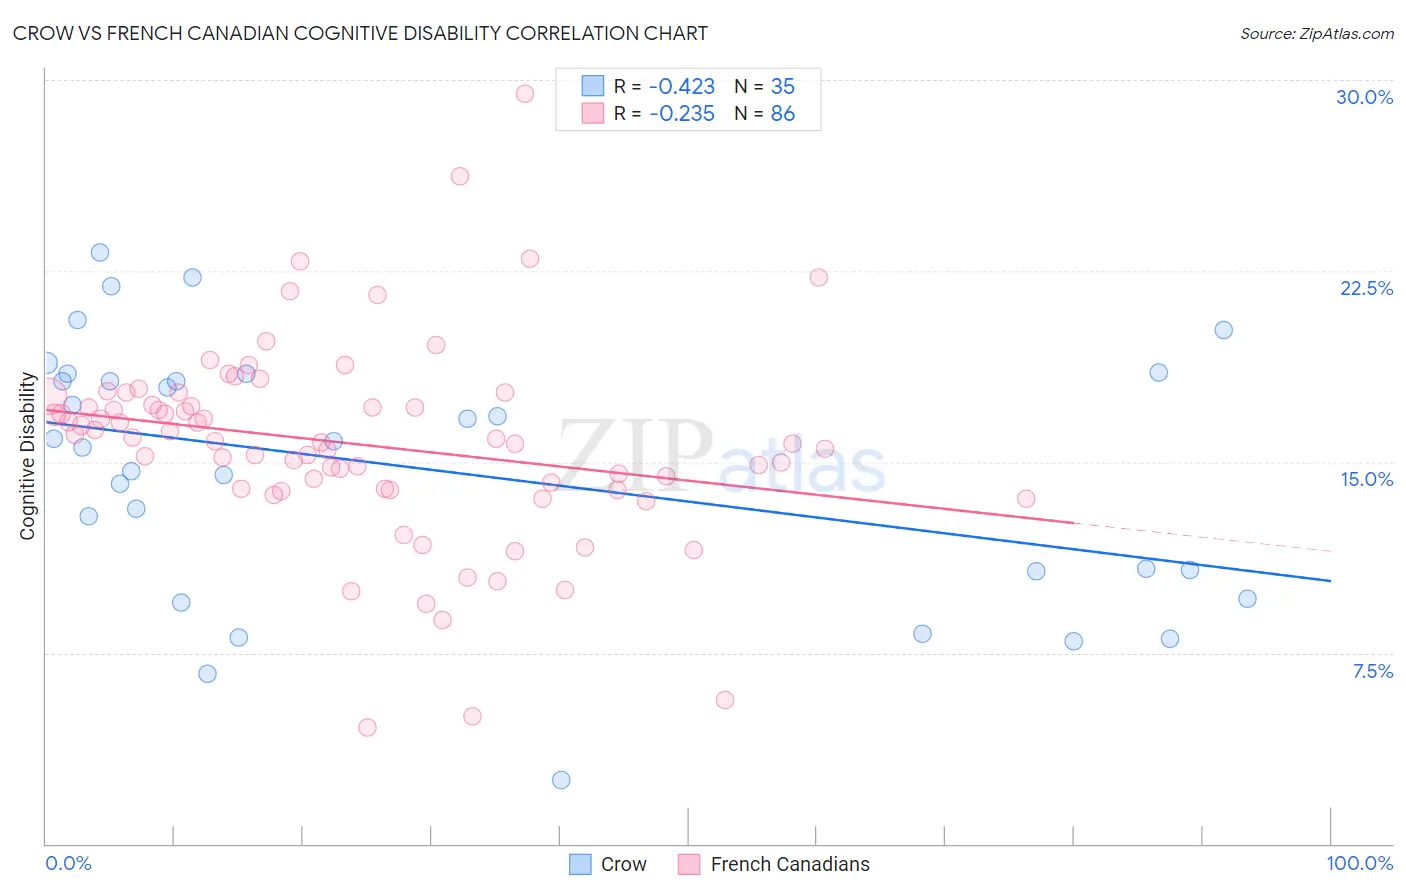
Crow vs French Canadian Cognitive Disability Correlation Chart
The statistical analysis conducted on geographies consisting of 59,204,553 people shows a moderate negative correlation between the proportion of Crow and percentage of population with cognitive disability in the United States with a correlation coefficient (R) of -0.423 and weighted average of 17.3%. Similarly, the statistical analysis conducted on geographies consisting of 502,569,589 people shows a weak negative correlation between the proportion of French Canadians and percentage of population with cognitive disability in the United States with a correlation coefficient (R) of -0.235 and weighted average of 17.1%, a difference of 1.6%.
Cognitive Disability Correlation Summary
| Measurement | Crow | French Canadian |
| Minimum | 2.5% | 4.5% |
| Maximum | 23.2% | 29.5% |
| Range | 20.7% | 24.9% |
| Mean | 14.7% | 15.7% |
| Median | 15.8% | 15.9% |
| Interquartile 25% (IQ1) | 10.7% | 13.9% |
| Interquartile 75% (IQ3) | 18.5% | 17.3% |
| Interquartile Range (IQR) | 7.8% | 3.3% |
| Standard Deviation (Sample) | 5.0% | 4.0% |
| Standard Deviation (Population) | 5.0% | 3.9% |
Similar Demographics by Cognitive Disability
Demographics Similar to Crow by Cognitive Disability
In terms of cognitive disability, the demographic groups most similar to Crow are Afghan (17.3%, a difference of 0.030%), Spaniard (17.3%, a difference of 0.040%), Cambodian (17.3%, a difference of 0.10%), Immigrants from Guyana (17.3%, a difference of 0.11%), and Arab (17.3%, a difference of 0.11%).
| Demographics | Rating | Rank | Cognitive Disability |
| Ute | 49.1 /100 | #177 | Average 17.3% |
| Spanish | 48.9 /100 | #178 | Average 17.3% |
| Sioux | 48.6 /100 | #179 | Average 17.3% |
| Pakistanis | 43.9 /100 | #180 | Average 17.3% |
| Immigrants | Guyana | 42.9 /100 | #181 | Average 17.3% |
| Arabs | 42.8 /100 | #182 | Average 17.3% |
| Spaniards | 40.3 /100 | #183 | Average 17.3% |
| Crow | 39.1 /100 | #184 | Fair 17.3% |
| Afghans | 38.2 /100 | #185 | Fair 17.3% |
| Cambodians | 35.9 /100 | #186 | Fair 17.3% |
| Immigrants | Fiji | 33.7 /100 | #187 | Fair 17.4% |
| Immigrants | France | 29.8 /100 | #188 | Fair 17.4% |
| Immigrants | Western Asia | 29.5 /100 | #189 | Fair 17.4% |
| Immigrants | Spain | 27.7 /100 | #190 | Fair 17.4% |
| Immigrants | Nonimmigrants | 27.4 /100 | #191 | Fair 17.4% |
Demographics Similar to French Canadians by Cognitive Disability
In terms of cognitive disability, the demographic groups most similar to French Canadians are Cypriot (17.1%, a difference of 0.0%), Scotch-Irish (17.1%, a difference of 0.010%), Basque (17.1%, a difference of 0.010%), Costa Rican (17.0%, a difference of 0.14%), and Syrian (17.1%, a difference of 0.15%).
| Demographics | Rating | Rank | Cognitive Disability |
| Aleuts | 89.9 /100 | #141 | Excellent 17.0% |
| Carpatho Rusyns | 89.6 /100 | #142 | Excellent 17.0% |
| British | 89.3 /100 | #143 | Excellent 17.0% |
| Immigrants | Brazil | 89.3 /100 | #144 | Excellent 17.0% |
| Immigrants | South Eastern Asia | 88.7 /100 | #145 | Excellent 17.0% |
| Costa Ricans | 88.0 /100 | #146 | Excellent 17.0% |
| Scotch-Irish | 85.9 /100 | #147 | Excellent 17.1% |
| French Canadians | 85.7 /100 | #148 | Excellent 17.1% |
| Cypriots | 85.7 /100 | #149 | Excellent 17.1% |
| Basques | 85.5 /100 | #150 | Excellent 17.1% |
| Syrians | 83.0 /100 | #151 | Excellent 17.1% |
| Immigrants | Indonesia | 82.7 /100 | #152 | Excellent 17.1% |
| Immigrants | Kazakhstan | 80.5 /100 | #153 | Excellent 17.1% |
| Immigrants | Malaysia | 79.3 /100 | #154 | Good 17.1% |
| Brazilians | 78.9 /100 | #155 | Good 17.1% |