Crow vs French Canadian Child Poverty Under the Age of 16
COMPARE
Crow
French Canadian
Child Poverty Under the Age of 16
Child Poverty Under the Age of 16 Comparison
Crow
French Canadians
26.0%
CHILD POVERTY UNDER THE AGE OF 16
0.0/ 100
METRIC RATING
339th/ 347
METRIC RANK
15.6%
CHILD POVERTY UNDER THE AGE OF 16
78.2/ 100
METRIC RATING
152nd/ 347
METRIC RANK
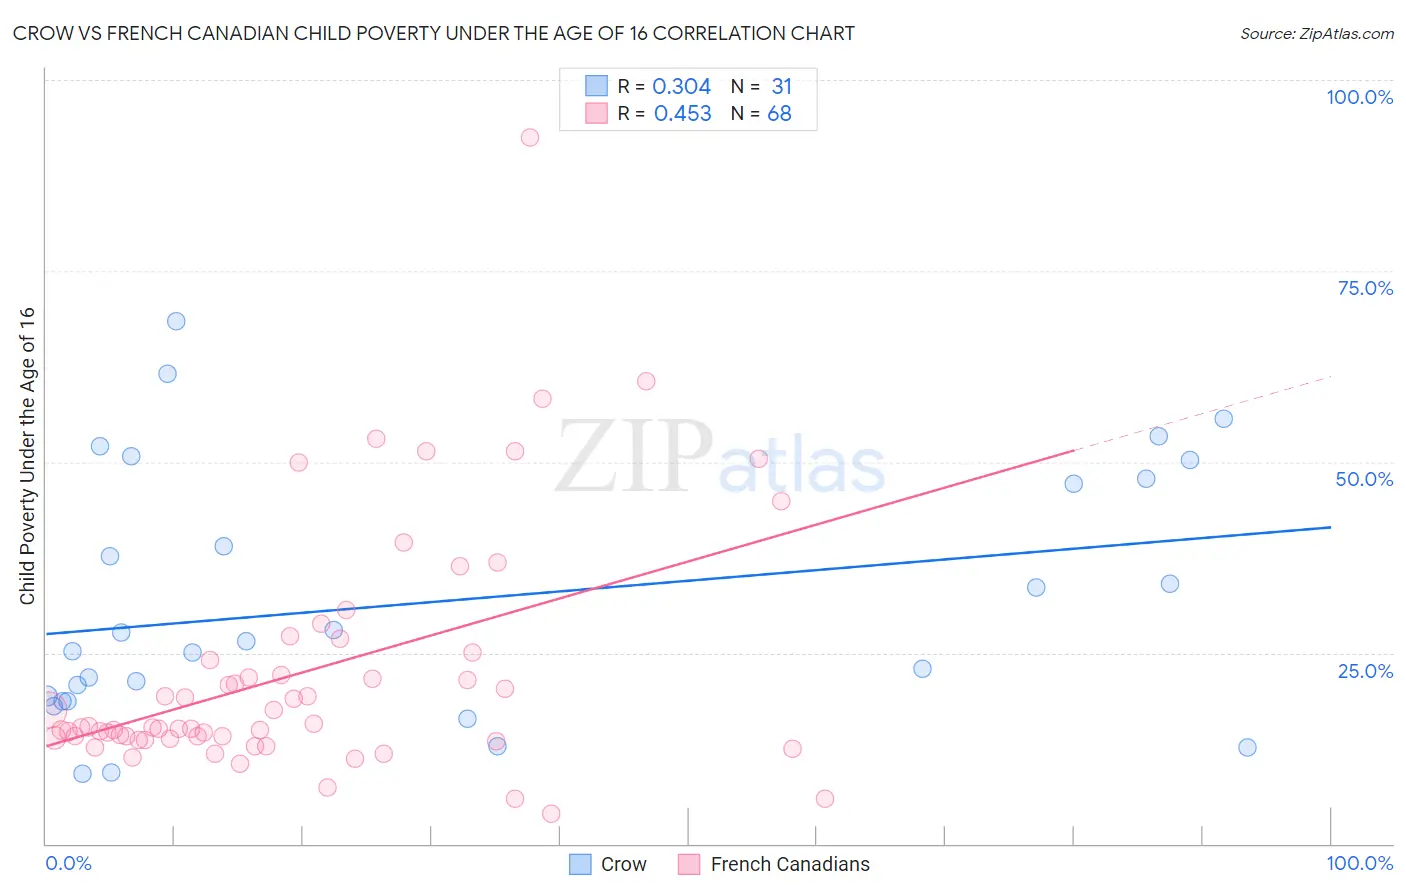
Crow vs French Canadian Child Poverty Under the Age of 16 Correlation Chart
The statistical analysis conducted on geographies consisting of 59,147,618 people shows a mild positive correlation between the proportion of Crow and poverty level among children under the age of 16 in the United States with a correlation coefficient (R) of 0.304 and weighted average of 26.0%. Similarly, the statistical analysis conducted on geographies consisting of 494,388,455 people shows a moderate positive correlation between the proportion of French Canadians and poverty level among children under the age of 16 in the United States with a correlation coefficient (R) of 0.453 and weighted average of 15.6%, a difference of 66.6%.
Child Poverty Under the Age of 16 Correlation Summary
| Measurement | Crow | French Canadian |
| Minimum | 9.2% | 3.9% |
| Maximum | 68.3% | 92.5% |
| Range | 59.2% | 88.5% |
| Mean | 31.8% | 22.5% |
| Median | 26.6% | 15.3% |
| Interquartile 25% (IQ1) | 18.7% | 13.8% |
| Interquartile 75% (IQ3) | 47.8% | 24.5% |
| Interquartile Range (IQR) | 29.2% | 10.8% |
| Standard Deviation (Sample) | 16.5% | 15.9% |
| Standard Deviation (Population) | 16.2% | 15.8% |
Similar Demographics by Child Poverty Under the Age of 16
Demographics Similar to Crow by Child Poverty Under the Age of 16
In terms of child poverty under the age of 16, the demographic groups most similar to Crow are Cheyenne (25.4%, a difference of 2.3%), Sioux (25.2%, a difference of 2.9%), Yup'ik (25.1%, a difference of 3.3%), Houma (24.9%, a difference of 4.4%), and Hopi (27.1%, a difference of 4.4%).
| Demographics | Rating | Rank | Child Poverty Under the Age of 16 |
| Pueblo | 0.0 /100 | #332 | Tragic 23.9% |
| Immigrants | Dominican Republic | 0.0 /100 | #333 | Tragic 24.0% |
| Blacks/African Americans | 0.0 /100 | #334 | Tragic 24.4% |
| Houma | 0.0 /100 | #335 | Tragic 24.9% |
| Yup'ik | 0.0 /100 | #336 | Tragic 25.1% |
| Sioux | 0.0 /100 | #337 | Tragic 25.2% |
| Cheyenne | 0.0 /100 | #338 | Tragic 25.4% |
| Crow | 0.0 /100 | #339 | Tragic 26.0% |
| Hopi | 0.0 /100 | #340 | Tragic 27.1% |
| Yuman | 0.0 /100 | #341 | Tragic 28.9% |
| Pima | 0.0 /100 | #342 | Tragic 29.0% |
| Immigrants | Yemen | 0.0 /100 | #343 | Tragic 29.1% |
| Navajo | 0.0 /100 | #344 | Tragic 30.2% |
| Lumbee | 0.0 /100 | #345 | Tragic 31.0% |
| Tohono O'odham | 0.0 /100 | #346 | Tragic 31.7% |
Demographics Similar to French Canadians by Child Poverty Under the Age of 16
In terms of child poverty under the age of 16, the demographic groups most similar to French Canadians are Immigrants from Jordan (15.6%, a difference of 0.040%), French (15.6%, a difference of 0.040%), Venezuelan (15.6%, a difference of 0.15%), Samoan (15.6%, a difference of 0.18%), and Israeli (15.5%, a difference of 0.36%).
| Demographics | Rating | Rank | Child Poverty Under the Age of 16 |
| Immigrants | Peru | 81.7 /100 | #145 | Excellent 15.5% |
| Slovaks | 81.4 /100 | #146 | Excellent 15.5% |
| Immigrants | Kuwait | 80.5 /100 | #147 | Excellent 15.5% |
| Puget Sound Salish | 80.3 /100 | #148 | Excellent 15.5% |
| Israelis | 80.1 /100 | #149 | Excellent 15.5% |
| Immigrants | Jordan | 78.5 /100 | #150 | Good 15.6% |
| French | 78.5 /100 | #151 | Good 15.6% |
| French Canadians | 78.2 /100 | #152 | Good 15.6% |
| Venezuelans | 77.4 /100 | #153 | Good 15.6% |
| Samoans | 77.3 /100 | #154 | Good 15.6% |
| Syrians | 76.1 /100 | #155 | Good 15.6% |
| Immigrants | Venezuela | 74.9 /100 | #156 | Good 15.7% |
| Immigrants | Nepal | 72.9 /100 | #157 | Good 15.7% |
| Immigrants | Chile | 72.8 /100 | #158 | Good 15.7% |
| Immigrants | Fiji | 71.1 /100 | #159 | Good 15.8% |