Crow vs French Canadian Female Poverty Among 25-34 Year Olds
COMPARE
Crow
French Canadian
Female Poverty Among 25-34 Year Olds
Female Poverty Among 25-34 Year Olds Comparison
Crow
French Canadians
22.7%
FEMALE POVERTY AMONG 25-34 YEAR OLDS
0.0/ 100
METRIC RATING
337th/ 347
METRIC RANK
14.3%
FEMALE POVERTY AMONG 25-34 YEAR OLDS
5.5/ 100
METRIC RATING
216th/ 347
METRIC RANK
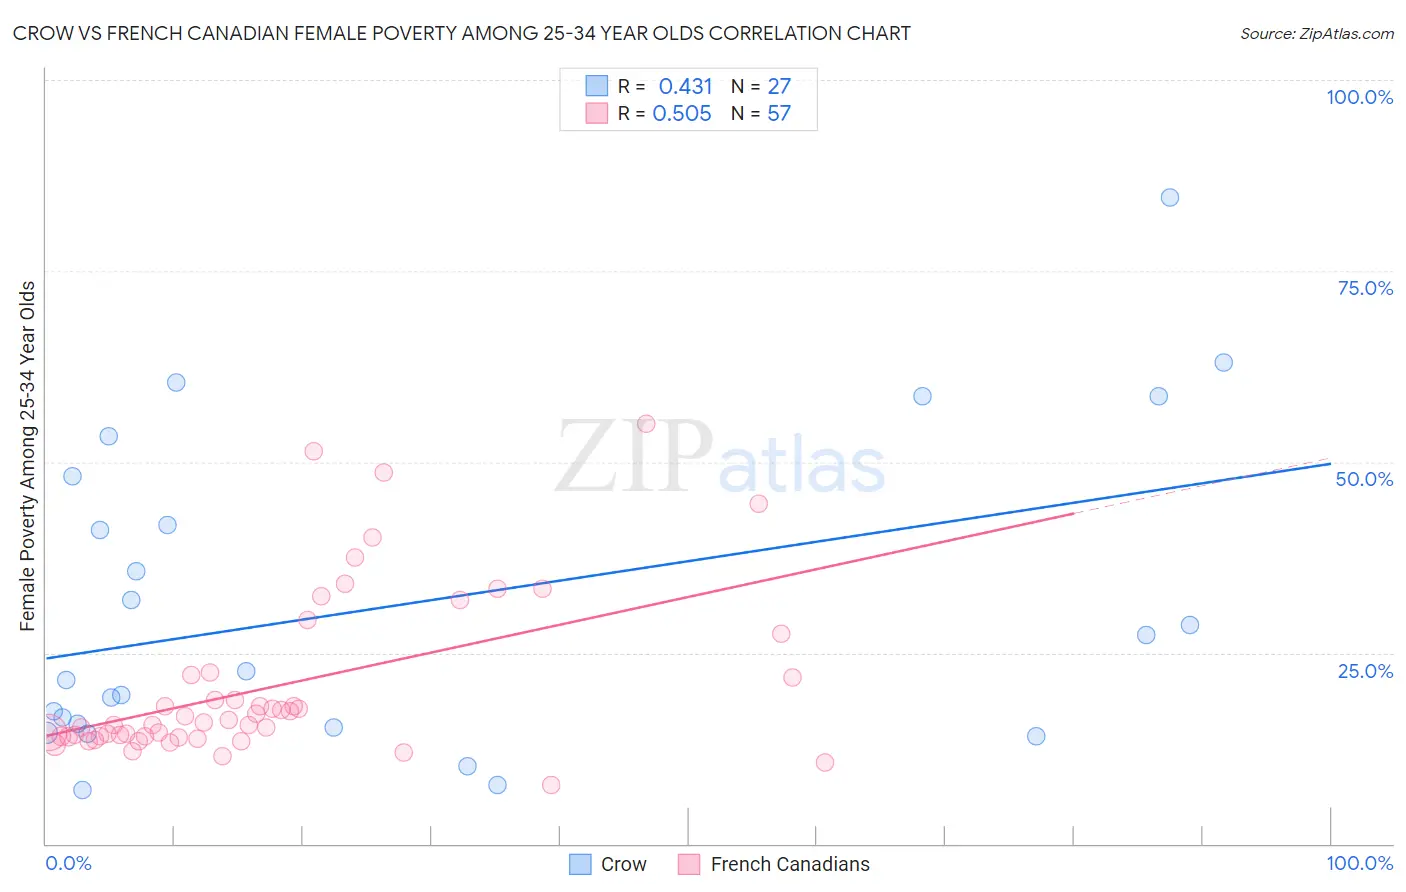
Crow vs French Canadian Female Poverty Among 25-34 Year Olds Correlation Chart
The statistical analysis conducted on geographies consisting of 59,005,346 people shows a moderate positive correlation between the proportion of Crow and poverty level among females between the ages 25 and 34 in the United States with a correlation coefficient (R) of 0.431 and weighted average of 22.7%. Similarly, the statistical analysis conducted on geographies consisting of 488,016,445 people shows a substantial positive correlation between the proportion of French Canadians and poverty level among females between the ages 25 and 34 in the United States with a correlation coefficient (R) of 0.505 and weighted average of 14.3%, a difference of 58.3%.
Female Poverty Among 25-34 Year Olds Correlation Summary
| Measurement | Crow | French Canadian |
| Minimum | 7.1% | 7.7% |
| Maximum | 84.6% | 55.0% |
| Range | 77.6% | 47.3% |
| Mean | 31.4% | 20.6% |
| Median | 22.7% | 15.8% |
| Interquartile 25% (IQ1) | 15.2% | 14.0% |
| Interquartile 75% (IQ3) | 48.1% | 22.2% |
| Interquartile Range (IQR) | 32.9% | 8.2% |
| Standard Deviation (Sample) | 20.6% | 10.9% |
| Standard Deviation (Population) | 20.2% | 10.8% |
Similar Demographics by Female Poverty Among 25-34 Year Olds
Demographics Similar to Crow by Female Poverty Among 25-34 Year Olds
In terms of female poverty among 25-34 year olds, the demographic groups most similar to Crow are Houma (22.7%, a difference of 0.17%), Yuman (22.9%, a difference of 1.0%), Sioux (23.0%, a difference of 1.2%), Pueblo (22.2%, a difference of 2.3%), and Navajo (23.3%, a difference of 2.9%).
| Demographics | Rating | Rank | Female Poverty Among 25-34 Year Olds |
| Paiute | 0.0 /100 | #330 | Tragic 19.6% |
| Kiowa | 0.0 /100 | #331 | Tragic 19.7% |
| Immigrants | Yemen | 0.0 /100 | #332 | Tragic 19.8% |
| Cajuns | 0.0 /100 | #333 | Tragic 19.9% |
| Apache | 0.0 /100 | #334 | Tragic 20.1% |
| Natives/Alaskans | 0.0 /100 | #335 | Tragic 20.3% |
| Pueblo | 0.0 /100 | #336 | Tragic 22.2% |
| Crow | 0.0 /100 | #337 | Tragic 22.7% |
| Houma | 0.0 /100 | #338 | Tragic 22.7% |
| Yuman | 0.0 /100 | #339 | Tragic 22.9% |
| Sioux | 0.0 /100 | #340 | Tragic 23.0% |
| Navajo | 0.0 /100 | #341 | Tragic 23.3% |
| Hopi | 0.0 /100 | #342 | Tragic 23.7% |
| Yup'ik | 0.0 /100 | #343 | Tragic 24.3% |
| Tohono O'odham | 0.0 /100 | #344 | Tragic 24.7% |
Demographics Similar to French Canadians by Female Poverty Among 25-34 Year Olds
In terms of female poverty among 25-34 year olds, the demographic groups most similar to French Canadians are Spanish American Indian (14.3%, a difference of 0.0%), Immigrants from Thailand (14.3%, a difference of 0.11%), Ecuadorian (14.3%, a difference of 0.12%), Immigrants from Nigeria (14.3%, a difference of 0.25%), and French (14.3%, a difference of 0.27%).
| Demographics | Rating | Rank | Female Poverty Among 25-34 Year Olds |
| Guyanese | 8.6 /100 | #209 | Tragic 14.2% |
| Panamanians | 8.6 /100 | #210 | Tragic 14.2% |
| Trinidadians and Tobagonians | 8.2 /100 | #211 | Tragic 14.2% |
| Immigrants | Guyana | 6.6 /100 | #212 | Tragic 14.3% |
| Puget Sound Salish | 6.5 /100 | #213 | Tragic 14.3% |
| French | 6.2 /100 | #214 | Tragic 14.3% |
| Immigrants | Nigeria | 6.2 /100 | #215 | Tragic 14.3% |
| French Canadians | 5.5 /100 | #216 | Tragic 14.3% |
| Spanish American Indians | 5.5 /100 | #217 | Tragic 14.3% |
| Immigrants | Thailand | 5.2 /100 | #218 | Tragic 14.3% |
| Ecuadorians | 5.2 /100 | #219 | Tragic 14.3% |
| Ghanaians | 4.8 /100 | #220 | Tragic 14.4% |
| Sudanese | 4.4 /100 | #221 | Tragic 14.4% |
| Immigrants | Portugal | 4.3 /100 | #222 | Tragic 14.4% |
| Nigerians | 4.2 /100 | #223 | Tragic 14.4% |