Crow vs Immigrants from Cuba Cognitive Disability
COMPARE
Crow
Immigrants from Cuba
Cognitive Disability
Cognitive Disability Comparison
Crow
Immigrants from Cuba
17.3%
COGNITIVE DISABILITY
39.1/ 100
METRIC RATING
184th/ 347
METRIC RANK
16.3%
COGNITIVE DISABILITY
100.0/ 100
METRIC RATING
21st/ 347
METRIC RANK
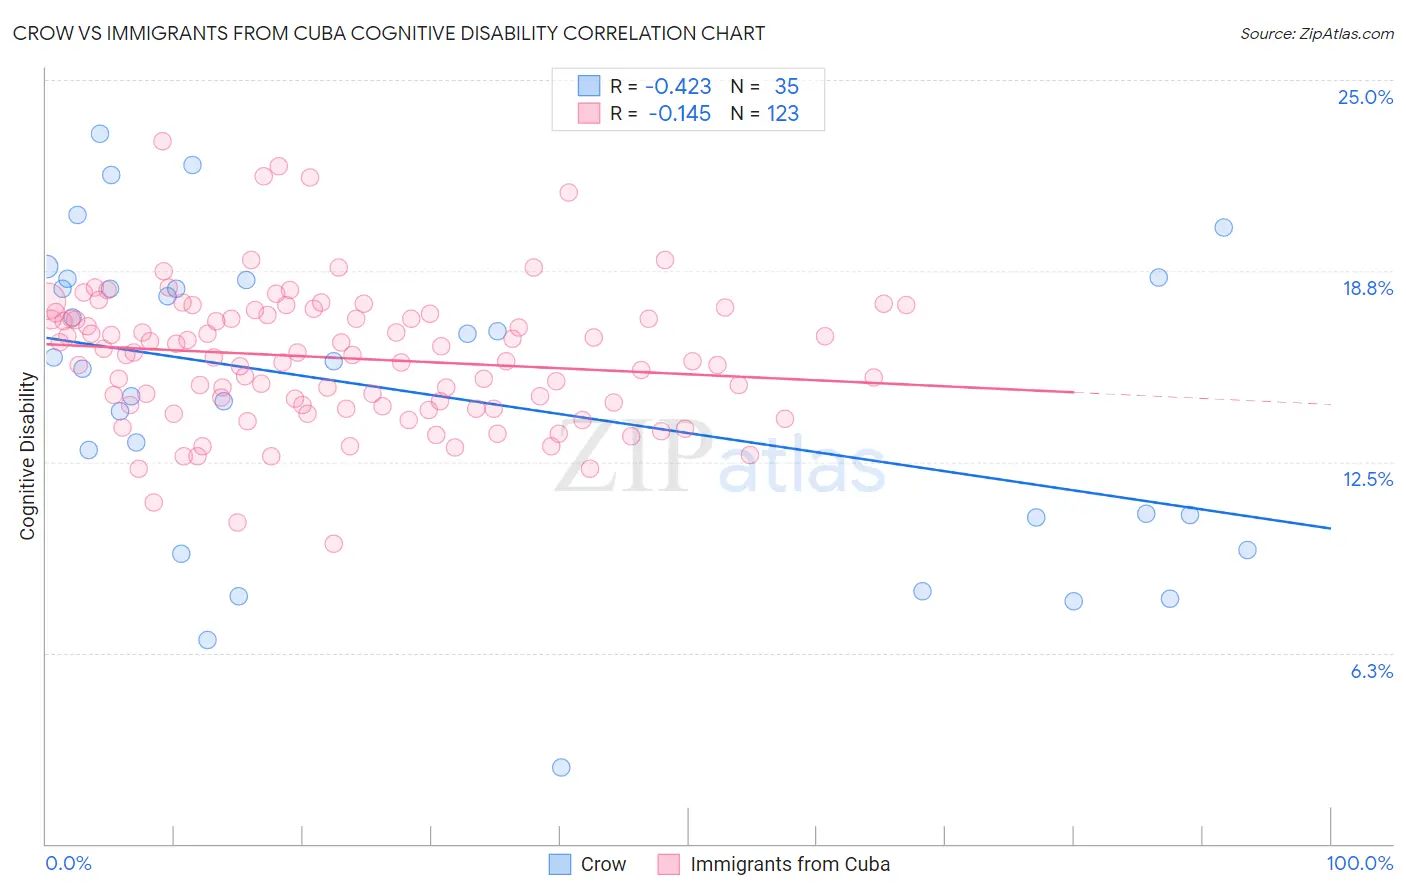
Crow vs Immigrants from Cuba Cognitive Disability Correlation Chart
The statistical analysis conducted on geographies consisting of 59,204,553 people shows a moderate negative correlation between the proportion of Crow and percentage of population with cognitive disability in the United States with a correlation coefficient (R) of -0.423 and weighted average of 17.3%. Similarly, the statistical analysis conducted on geographies consisting of 325,949,473 people shows a poor negative correlation between the proportion of Immigrants from Cuba and percentage of population with cognitive disability in the United States with a correlation coefficient (R) of -0.145 and weighted average of 16.3%, a difference of 6.1%.
Cognitive Disability Correlation Summary
| Measurement | Crow | Immigrants from Cuba |
| Minimum | 2.5% | 9.8% |
| Maximum | 23.2% | 23.0% |
| Range | 20.7% | 13.2% |
| Mean | 14.7% | 15.9% |
| Median | 15.8% | 16.0% |
| Interquartile 25% (IQ1) | 10.7% | 14.3% |
| Interquartile 75% (IQ3) | 18.5% | 17.3% |
| Interquartile Range (IQR) | 7.8% | 3.0% |
| Standard Deviation (Sample) | 5.0% | 2.3% |
| Standard Deviation (Population) | 5.0% | 2.3% |
Similar Demographics by Cognitive Disability
Demographics Similar to Crow by Cognitive Disability
In terms of cognitive disability, the demographic groups most similar to Crow are Afghan (17.3%, a difference of 0.030%), Spaniard (17.3%, a difference of 0.040%), Cambodian (17.3%, a difference of 0.10%), Immigrants from Guyana (17.3%, a difference of 0.11%), and Arab (17.3%, a difference of 0.11%).
| Demographics | Rating | Rank | Cognitive Disability |
| Ute | 49.1 /100 | #177 | Average 17.3% |
| Spanish | 48.9 /100 | #178 | Average 17.3% |
| Sioux | 48.6 /100 | #179 | Average 17.3% |
| Pakistanis | 43.9 /100 | #180 | Average 17.3% |
| Immigrants | Guyana | 42.9 /100 | #181 | Average 17.3% |
| Arabs | 42.8 /100 | #182 | Average 17.3% |
| Spaniards | 40.3 /100 | #183 | Average 17.3% |
| Crow | 39.1 /100 | #184 | Fair 17.3% |
| Afghans | 38.2 /100 | #185 | Fair 17.3% |
| Cambodians | 35.9 /100 | #186 | Fair 17.3% |
| Immigrants | Fiji | 33.7 /100 | #187 | Fair 17.4% |
| Immigrants | France | 29.8 /100 | #188 | Fair 17.4% |
| Immigrants | Western Asia | 29.5 /100 | #189 | Fair 17.4% |
| Immigrants | Spain | 27.7 /100 | #190 | Fair 17.4% |
| Immigrants | Nonimmigrants | 27.4 /100 | #191 | Fair 17.4% |
Demographics Similar to Immigrants from Cuba by Cognitive Disability
In terms of cognitive disability, the demographic groups most similar to Immigrants from Cuba are Bulgarian (16.3%, a difference of 0.040%), Immigrants from Northern Europe (16.3%, a difference of 0.060%), Immigrants from Bolivia (16.3%, a difference of 0.060%), Immigrants from North Macedonia (16.3%, a difference of 0.12%), and Immigrants from South Central Asia (16.4%, a difference of 0.13%).
| Demographics | Rating | Rank | Cognitive Disability |
| Immigrants | Austria | 100.0 /100 | #14 | Exceptional 16.3% |
| Immigrants | Greece | 100.0 /100 | #15 | Exceptional 16.3% |
| Eastern Europeans | 100.0 /100 | #16 | Exceptional 16.3% |
| Immigrants | North Macedonia | 100.0 /100 | #17 | Exceptional 16.3% |
| Immigrants | Northern Europe | 100.0 /100 | #18 | Exceptional 16.3% |
| Immigrants | Bolivia | 100.0 /100 | #19 | Exceptional 16.3% |
| Bulgarians | 100.0 /100 | #20 | Exceptional 16.3% |
| Immigrants | Cuba | 100.0 /100 | #21 | Exceptional 16.3% |
| Immigrants | South Central Asia | 99.9 /100 | #22 | Exceptional 16.4% |
| Croatians | 99.9 /100 | #23 | Exceptional 16.4% |
| Immigrants | Argentina | 99.9 /100 | #24 | Exceptional 16.4% |
| Luxembourgers | 99.9 /100 | #25 | Exceptional 16.4% |
| Immigrants | Croatia | 99.9 /100 | #26 | Exceptional 16.4% |
| Immigrants | Pakistan | 99.9 /100 | #27 | Exceptional 16.4% |
| Poles | 99.9 /100 | #28 | Exceptional 16.4% |