Creek vs Tlingit-Haida Disability Age 35 to 64
COMPARE
Creek
Tlingit-Haida
Disability Age 35 to 64
Disability Age 35 to 64 Comparison
Creek
Tlingit-Haida
16.9%
DISABILITY AGE 35 TO 64
0.0/ 100
METRIC RATING
343rd/ 347
METRIC RANK
13.2%
DISABILITY AGE 35 TO 64
0.0/ 100
METRIC RATING
287th/ 347
METRIC RANK
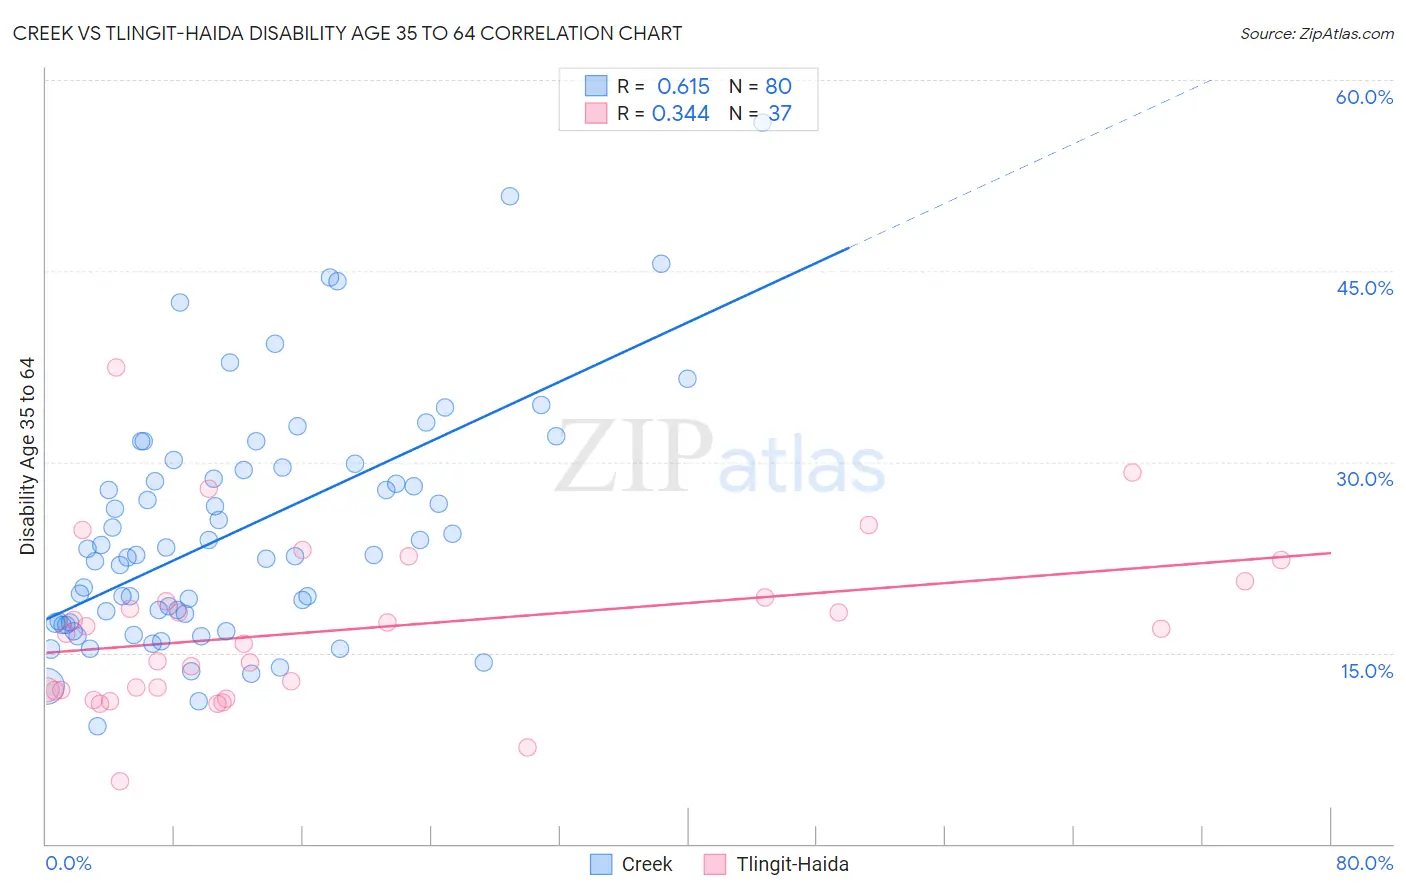
Creek vs Tlingit-Haida Disability Age 35 to 64 Correlation Chart
The statistical analysis conducted on geographies consisting of 178,427,541 people shows a significant positive correlation between the proportion of Creek and percentage of population with a disability between the ages 34 and 64 in the United States with a correlation coefficient (R) of 0.615 and weighted average of 16.9%. Similarly, the statistical analysis conducted on geographies consisting of 60,853,720 people shows a mild positive correlation between the proportion of Tlingit-Haida and percentage of population with a disability between the ages 34 and 64 in the United States with a correlation coefficient (R) of 0.344 and weighted average of 13.2%, a difference of 28.1%.
Disability Age 35 to 64 Correlation Summary
| Measurement | Creek | Tlingit-Haida |
| Minimum | 9.2% | 4.9% |
| Maximum | 56.7% | 37.4% |
| Range | 47.4% | 32.4% |
| Mean | 24.6% | 16.8% |
| Median | 22.7% | 16.5% |
| Interquartile 25% (IQ1) | 17.4% | 12.1% |
| Interquartile 75% (IQ3) | 29.5% | 20.0% |
| Interquartile Range (IQR) | 12.1% | 7.9% |
| Standard Deviation (Sample) | 9.4% | 6.5% |
| Standard Deviation (Population) | 9.3% | 6.4% |
Similar Demographics by Disability Age 35 to 64
Demographics Similar to Creek by Disability Age 35 to 64
In terms of disability age 35 to 64, the demographic groups most similar to Creek are Yup'ik (16.9%, a difference of 0.32%), Tohono O'odham (16.7%, a difference of 0.86%), Tsimshian (16.7%, a difference of 0.97%), Kiowa (17.4%, a difference of 2.8%), and Choctaw (16.4%, a difference of 2.9%).
| Demographics | Rating | Rank | Disability Age 35 to 64 |
| Yuman | 0.0 /100 | #333 | Tragic 15.8% |
| Colville | 0.0 /100 | #334 | Tragic 15.8% |
| Seminole | 0.0 /100 | #335 | Tragic 15.9% |
| Menominee | 0.0 /100 | #336 | Tragic 15.9% |
| Puerto Ricans | 0.0 /100 | #337 | Tragic 15.9% |
| Chickasaw | 0.0 /100 | #338 | Tragic 16.1% |
| Pima | 0.0 /100 | #339 | Tragic 16.1% |
| Choctaw | 0.0 /100 | #340 | Tragic 16.4% |
| Tsimshian | 0.0 /100 | #341 | Tragic 16.7% |
| Tohono O'odham | 0.0 /100 | #342 | Tragic 16.7% |
| Creek | 0.0 /100 | #343 | Tragic 16.9% |
| Yup'ik | 0.0 /100 | #344 | Tragic 16.9% |
| Kiowa | 0.0 /100 | #345 | Tragic 17.4% |
| Lumbee | 0.0 /100 | #346 | Tragic 17.6% |
| Houma | 0.0 /100 | #347 | Tragic 18.7% |
Demographics Similar to Tlingit-Haida by Disability Age 35 to 64
In terms of disability age 35 to 64, the demographic groups most similar to Tlingit-Haida are Hmong (13.1%, a difference of 0.27%), Fijian (13.2%, a difference of 0.35%), Indonesian (13.2%, a difference of 0.42%), Immigrants from Liberia (13.2%, a difference of 0.50%), and Immigrants from Somalia (13.1%, a difference of 0.58%).
| Demographics | Rating | Rank | Disability Age 35 to 64 |
| Liberians | 0.1 /100 | #280 | Tragic 12.9% |
| Scotch-Irish | 0.1 /100 | #281 | Tragic 13.0% |
| Immigrants | Laos | 0.1 /100 | #282 | Tragic 13.0% |
| Central American Indians | 0.0 /100 | #283 | Tragic 13.0% |
| Immigrants | Nonimmigrants | 0.0 /100 | #284 | Tragic 13.0% |
| Immigrants | Somalia | 0.0 /100 | #285 | Tragic 13.1% |
| Hmong | 0.0 /100 | #286 | Tragic 13.1% |
| Tlingit-Haida | 0.0 /100 | #287 | Tragic 13.2% |
| Fijians | 0.0 /100 | #288 | Tragic 13.2% |
| Indonesians | 0.0 /100 | #289 | Tragic 13.2% |
| Immigrants | Liberia | 0.0 /100 | #290 | Tragic 13.2% |
| Immigrants | Congo | 0.0 /100 | #291 | Tragic 13.3% |
| Puget Sound Salish | 0.0 /100 | #292 | Tragic 13.3% |
| Ute | 0.0 /100 | #293 | Tragic 13.4% |
| Yaqui | 0.0 /100 | #294 | Tragic 13.5% |