Creek vs European Disability Age 35 to 64
COMPARE
Creek
European
Disability Age 35 to 64
Disability Age 35 to 64 Comparison
Creek
Europeans
16.9%
DISABILITY AGE 35 TO 64
0.0/ 100
METRIC RATING
343rd/ 347
METRIC RANK
11.7%
DISABILITY AGE 35 TO 64
13.5/ 100
METRIC RATING
209th/ 347
METRIC RANK
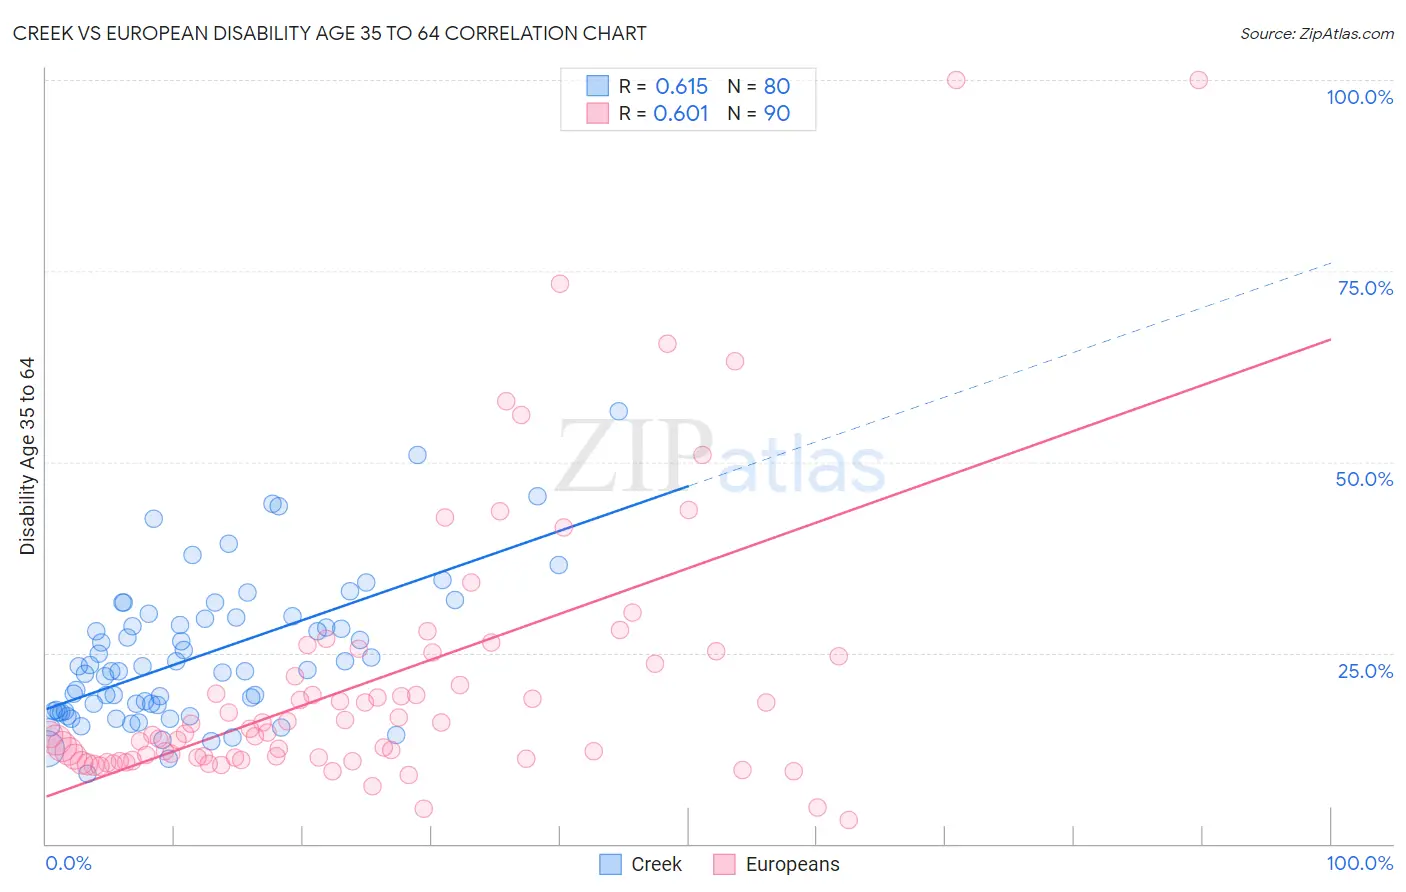
Creek vs European Disability Age 35 to 64 Correlation Chart
The statistical analysis conducted on geographies consisting of 178,427,541 people shows a significant positive correlation between the proportion of Creek and percentage of population with a disability between the ages 34 and 64 in the United States with a correlation coefficient (R) of 0.615 and weighted average of 16.9%. Similarly, the statistical analysis conducted on geographies consisting of 560,896,486 people shows a significant positive correlation between the proportion of Europeans and percentage of population with a disability between the ages 34 and 64 in the United States with a correlation coefficient (R) of 0.601 and weighted average of 11.7%, a difference of 44.4%.
Disability Age 35 to 64 Correlation Summary
| Measurement | Creek | European |
| Minimum | 9.2% | 3.2% |
| Maximum | 56.7% | 100.0% |
| Range | 47.4% | 96.8% |
| Mean | 24.6% | 21.5% |
| Median | 22.7% | 14.5% |
| Interquartile 25% (IQ1) | 17.4% | 11.2% |
| Interquartile 75% (IQ3) | 29.5% | 24.6% |
| Interquartile Range (IQR) | 12.1% | 13.4% |
| Standard Deviation (Sample) | 9.4% | 18.3% |
| Standard Deviation (Population) | 9.3% | 18.2% |
Similar Demographics by Disability Age 35 to 64
Demographics Similar to Creek by Disability Age 35 to 64
In terms of disability age 35 to 64, the demographic groups most similar to Creek are Yup'ik (16.9%, a difference of 0.32%), Tohono O'odham (16.7%, a difference of 0.86%), Tsimshian (16.7%, a difference of 0.97%), Kiowa (17.4%, a difference of 2.8%), and Choctaw (16.4%, a difference of 2.9%).
| Demographics | Rating | Rank | Disability Age 35 to 64 |
| Yuman | 0.0 /100 | #333 | Tragic 15.8% |
| Colville | 0.0 /100 | #334 | Tragic 15.8% |
| Seminole | 0.0 /100 | #335 | Tragic 15.9% |
| Menominee | 0.0 /100 | #336 | Tragic 15.9% |
| Puerto Ricans | 0.0 /100 | #337 | Tragic 15.9% |
| Chickasaw | 0.0 /100 | #338 | Tragic 16.1% |
| Pima | 0.0 /100 | #339 | Tragic 16.1% |
| Choctaw | 0.0 /100 | #340 | Tragic 16.4% |
| Tsimshian | 0.0 /100 | #341 | Tragic 16.7% |
| Tohono O'odham | 0.0 /100 | #342 | Tragic 16.7% |
| Creek | 0.0 /100 | #343 | Tragic 16.9% |
| Yup'ik | 0.0 /100 | #344 | Tragic 16.9% |
| Kiowa | 0.0 /100 | #345 | Tragic 17.4% |
| Lumbee | 0.0 /100 | #346 | Tragic 17.6% |
| Houma | 0.0 /100 | #347 | Tragic 18.7% |
Demographics Similar to Europeans by Disability Age 35 to 64
In terms of disability age 35 to 64, the demographic groups most similar to Europeans are Belgian (11.7%, a difference of 0.070%), Canadian (11.7%, a difference of 0.080%), Guatemalan (11.7%, a difference of 0.19%), Native Hawaiian (11.7%, a difference of 0.22%), and Ghanaian (11.7%, a difference of 0.22%).
| Demographics | Rating | Rank | Disability Age 35 to 64 |
| Immigrants | Guatemala | 17.5 /100 | #202 | Poor 11.6% |
| British | 17.0 /100 | #203 | Poor 11.6% |
| Nigerians | 16.3 /100 | #204 | Poor 11.6% |
| Slavs | 15.5 /100 | #205 | Poor 11.7% |
| Native Hawaiians | 14.8 /100 | #206 | Poor 11.7% |
| Ghanaians | 14.8 /100 | #207 | Poor 11.7% |
| Guatemalans | 14.6 /100 | #208 | Poor 11.7% |
| Europeans | 13.5 /100 | #209 | Poor 11.7% |
| Belgians | 13.1 /100 | #210 | Poor 11.7% |
| Canadians | 13.0 /100 | #211 | Poor 11.7% |
| Immigrants | Jamaica | 11.8 /100 | #212 | Poor 11.7% |
| Yugoslavians | 11.6 /100 | #213 | Poor 11.7% |
| Immigrants | Sudan | 11.4 /100 | #214 | Poor 11.7% |
| Spanish American Indians | 11.1 /100 | #215 | Poor 11.7% |
| Bahamians | 10.7 /100 | #216 | Poor 11.8% |