Soviet Union vs European Disability Age 35 to 64
COMPARE
Soviet Union
European
Disability Age 35 to 64
Disability Age 35 to 64 Comparison
Soviet Union
Europeans
9.2%
DISABILITY AGE 35 TO 64
100.0/ 100
METRIC RATING
18th/ 347
METRIC RANK
11.7%
DISABILITY AGE 35 TO 64
13.5/ 100
METRIC RATING
209th/ 347
METRIC RANK
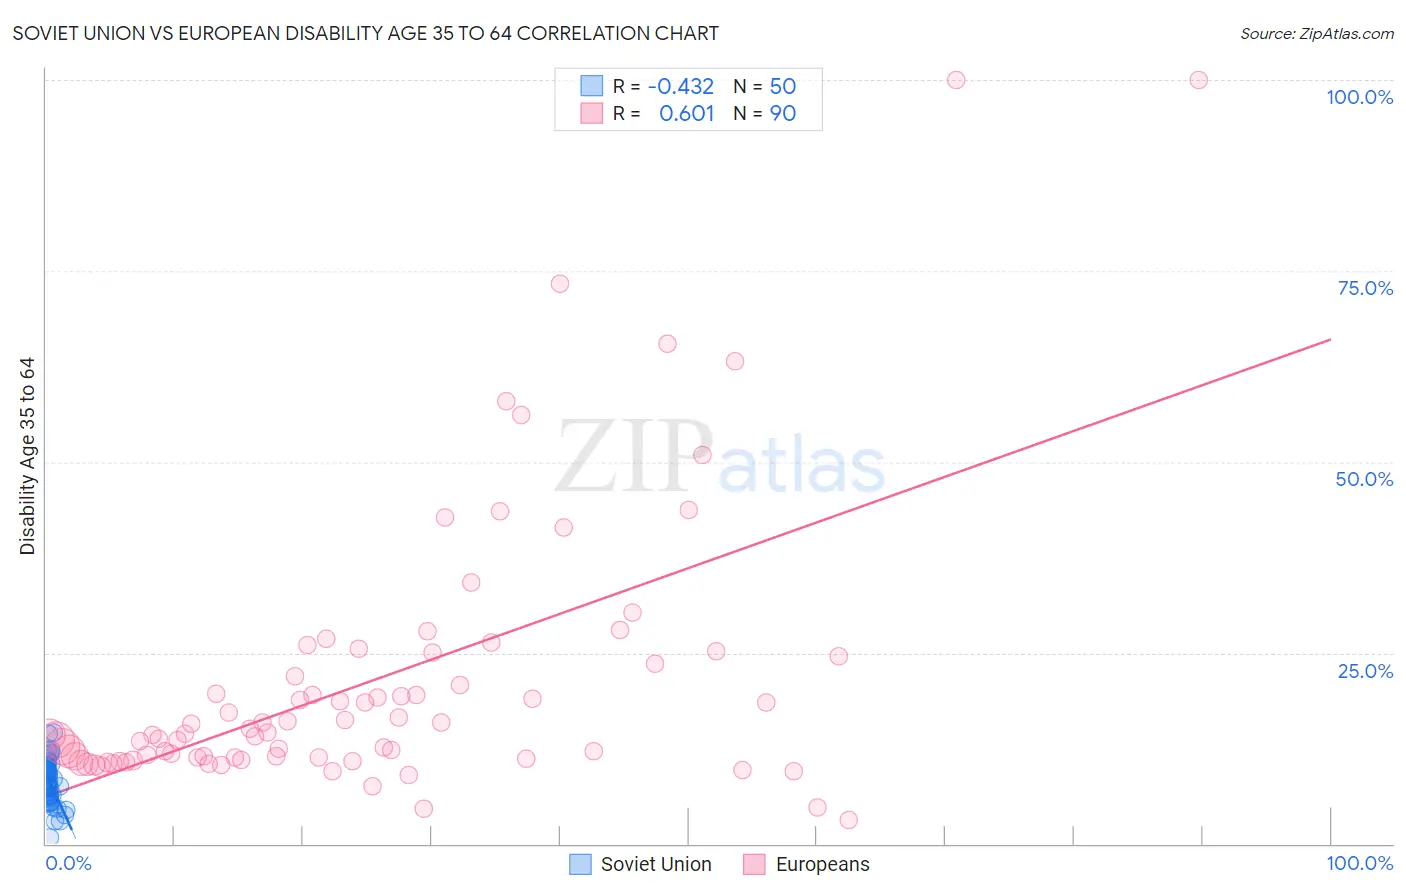
Soviet Union vs European Disability Age 35 to 64 Correlation Chart
The statistical analysis conducted on geographies consisting of 43,509,630 people shows a moderate negative correlation between the proportion of Soviet Union and percentage of population with a disability between the ages 34 and 64 in the United States with a correlation coefficient (R) of -0.432 and weighted average of 9.2%. Similarly, the statistical analysis conducted on geographies consisting of 560,896,486 people shows a significant positive correlation between the proportion of Europeans and percentage of population with a disability between the ages 34 and 64 in the United States with a correlation coefficient (R) of 0.601 and weighted average of 11.7%, a difference of 26.4%.
Disability Age 35 to 64 Correlation Summary
| Measurement | Soviet Union | European |
| Minimum | 0.79% | 3.2% |
| Maximum | 14.6% | 100.0% |
| Range | 13.8% | 96.8% |
| Mean | 8.0% | 21.5% |
| Median | 7.8% | 14.5% |
| Interquartile 25% (IQ1) | 5.8% | 11.2% |
| Interquartile 75% (IQ3) | 10.1% | 24.6% |
| Interquartile Range (IQR) | 4.3% | 13.4% |
| Standard Deviation (Sample) | 3.0% | 18.3% |
| Standard Deviation (Population) | 2.9% | 18.2% |
Similar Demographics by Disability Age 35 to 64
Demographics Similar to Soviet Union by Disability Age 35 to 64
In terms of disability age 35 to 64, the demographic groups most similar to Soviet Union are Immigrants from Venezuela (9.3%, a difference of 0.24%), Burmese (9.2%, a difference of 0.41%), Immigrants from Argentina (9.3%, a difference of 0.75%), Okinawan (9.4%, a difference of 1.2%), and Cypriot (9.4%, a difference of 1.2%).
| Demographics | Rating | Rank | Disability Age 35 to 64 |
| Immigrants | Eastern Asia | 100.0 /100 | #11 | Exceptional 8.8% |
| Indians (Asian) | 100.0 /100 | #12 | Exceptional 8.9% |
| Immigrants | South Central Asia | 100.0 /100 | #13 | Exceptional 8.9% |
| Immigrants | Singapore | 100.0 /100 | #14 | Exceptional 8.9% |
| Bolivians | 100.0 /100 | #15 | Exceptional 8.9% |
| Immigrants | Korea | 100.0 /100 | #16 | Exceptional 9.0% |
| Burmese | 100.0 /100 | #17 | Exceptional 9.2% |
| Soviet Union | 100.0 /100 | #18 | Exceptional 9.2% |
| Immigrants | Venezuela | 100.0 /100 | #19 | Exceptional 9.3% |
| Immigrants | Argentina | 100.0 /100 | #20 | Exceptional 9.3% |
| Okinawans | 100.0 /100 | #21 | Exceptional 9.4% |
| Cypriots | 100.0 /100 | #22 | Exceptional 9.4% |
| Argentineans | 100.0 /100 | #23 | Exceptional 9.4% |
| Asians | 100.0 /100 | #24 | Exceptional 9.4% |
| Venezuelans | 100.0 /100 | #25 | Exceptional 9.4% |
Demographics Similar to Europeans by Disability Age 35 to 64
In terms of disability age 35 to 64, the demographic groups most similar to Europeans are Belgian (11.7%, a difference of 0.070%), Canadian (11.7%, a difference of 0.080%), Guatemalan (11.7%, a difference of 0.19%), Native Hawaiian (11.7%, a difference of 0.22%), and Ghanaian (11.7%, a difference of 0.22%).
| Demographics | Rating | Rank | Disability Age 35 to 64 |
| Immigrants | Guatemala | 17.5 /100 | #202 | Poor 11.6% |
| British | 17.0 /100 | #203 | Poor 11.6% |
| Nigerians | 16.3 /100 | #204 | Poor 11.6% |
| Slavs | 15.5 /100 | #205 | Poor 11.7% |
| Native Hawaiians | 14.8 /100 | #206 | Poor 11.7% |
| Ghanaians | 14.8 /100 | #207 | Poor 11.7% |
| Guatemalans | 14.6 /100 | #208 | Poor 11.7% |
| Europeans | 13.5 /100 | #209 | Poor 11.7% |
| Belgians | 13.1 /100 | #210 | Poor 11.7% |
| Canadians | 13.0 /100 | #211 | Poor 11.7% |
| Immigrants | Jamaica | 11.8 /100 | #212 | Poor 11.7% |
| Yugoslavians | 11.6 /100 | #213 | Poor 11.7% |
| Immigrants | Sudan | 11.4 /100 | #214 | Poor 11.7% |
| Spanish American Indians | 11.1 /100 | #215 | Poor 11.7% |
| Bahamians | 10.7 /100 | #216 | Poor 11.8% |