Creek vs Apache Disability Age 65 to 74
COMPARE
Creek
Apache
Disability Age 65 to 74
Disability Age 65 to 74 Comparison
Creek
Apache
30.2%
DISABILITY AGE 65 TO 74
0.0/ 100
METRIC RATING
330th/ 347
METRIC RANK
29.7%
DISABILITY AGE 65 TO 74
0.0/ 100
METRIC RATING
327th/ 347
METRIC RANK
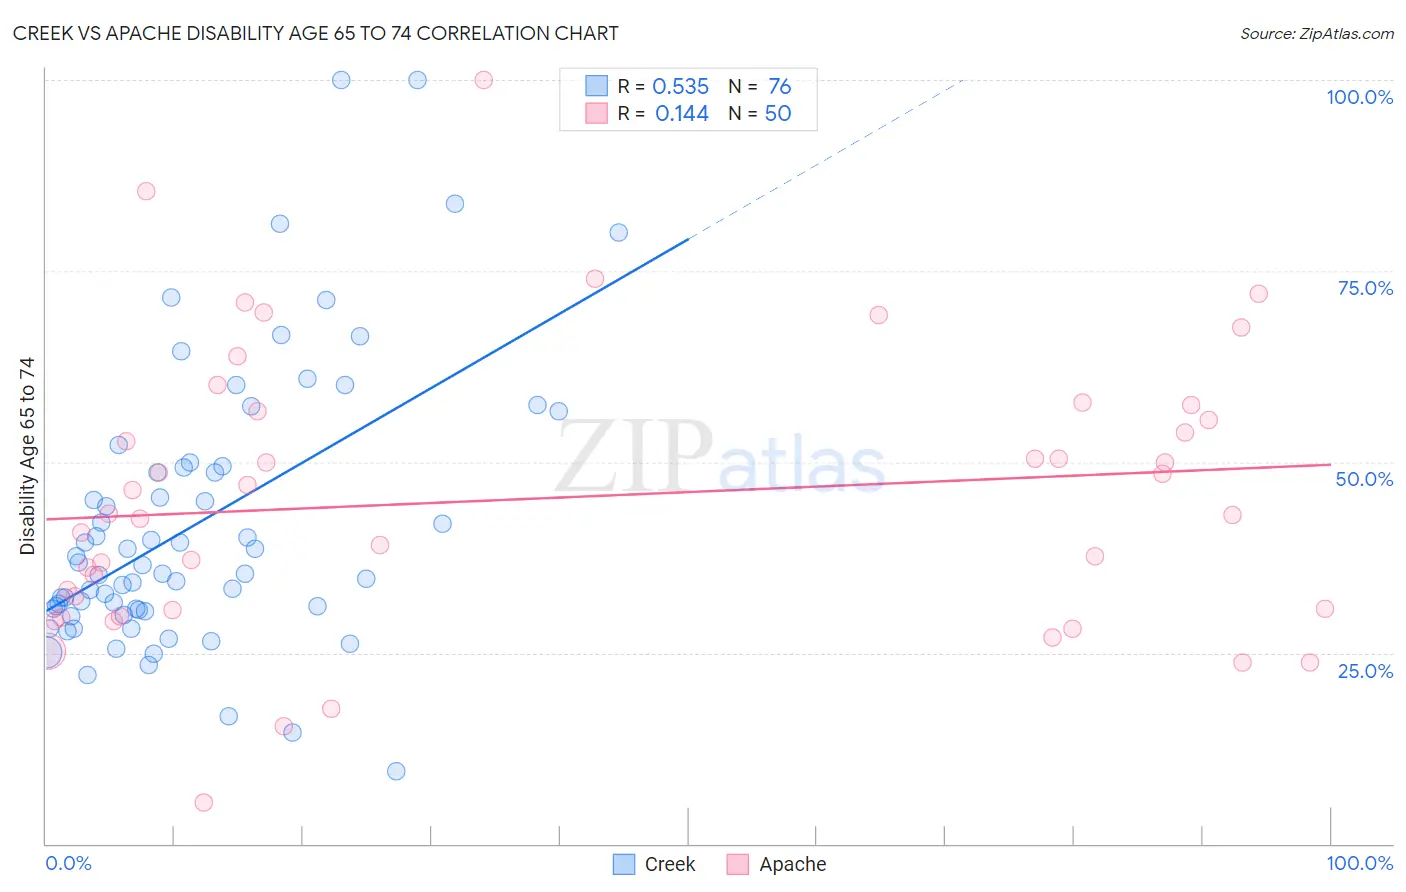
Creek vs Apache Disability Age 65 to 74 Correlation Chart
The statistical analysis conducted on geographies consisting of 178,280,252 people shows a substantial positive correlation between the proportion of Creek and percentage of population with a disability between the ages 65 and 75 in the United States with a correlation coefficient (R) of 0.535 and weighted average of 30.2%. Similarly, the statistical analysis conducted on geographies consisting of 230,808,066 people shows a poor positive correlation between the proportion of Apache and percentage of population with a disability between the ages 65 and 75 in the United States with a correlation coefficient (R) of 0.144 and weighted average of 29.7%, a difference of 1.8%.
Disability Age 65 to 74 Correlation Summary
| Measurement | Creek | Apache |
| Minimum | 9.4% | 5.4% |
| Maximum | 100.0% | 100.0% |
| Range | 90.6% | 94.6% |
| Mean | 41.9% | 45.2% |
| Median | 35.9% | 43.2% |
| Interquartile 25% (IQ1) | 30.7% | 30.6% |
| Interquartile 75% (IQ3) | 49.3% | 56.6% |
| Interquartile Range (IQR) | 18.6% | 26.0% |
| Standard Deviation (Sample) | 18.2% | 18.7% |
| Standard Deviation (Population) | 18.1% | 18.6% |
Demographics Similar to Creek and Apache by Disability Age 65 to 74
In terms of disability age 65 to 74, the demographic groups most similar to Creek are Chickasaw (30.2%, a difference of 0.010%), Choctaw (30.2%, a difference of 0.030%), Native/Alaskan (30.4%, a difference of 0.63%), Hopi (30.0%, a difference of 0.83%), and Colville (30.5%, a difference of 1.1%). Similarly, the demographic groups most similar to Apache are Yakama (29.6%, a difference of 0.16%), Dutch West Indian (29.6%, a difference of 0.38%), Seminole (29.4%, a difference of 0.83%), Hopi (30.0%, a difference of 0.94%), and Choctaw (30.2%, a difference of 1.8%).
| Demographics | Rating | Rank | Disability Age 65 to 74 |
| Nepalese | 0.0 /100 | #318 | Tragic 28.0% |
| Arapaho | 0.0 /100 | #319 | Tragic 28.1% |
| Cherokee | 0.0 /100 | #320 | Tragic 28.2% |
| Comanche | 0.0 /100 | #321 | Tragic 28.3% |
| Aleuts | 0.0 /100 | #322 | Tragic 28.4% |
| Puerto Ricans | 0.0 /100 | #323 | Tragic 29.1% |
| Seminole | 0.0 /100 | #324 | Tragic 29.4% |
| Dutch West Indians | 0.0 /100 | #325 | Tragic 29.6% |
| Yakama | 0.0 /100 | #326 | Tragic 29.6% |
| Apache | 0.0 /100 | #327 | Tragic 29.7% |
| Hopi | 0.0 /100 | #328 | Tragic 30.0% |
| Choctaw | 0.0 /100 | #329 | Tragic 30.2% |
| Creek | 0.0 /100 | #330 | Tragic 30.2% |
| Chickasaw | 0.0 /100 | #331 | Tragic 30.2% |
| Natives/Alaskans | 0.0 /100 | #332 | Tragic 30.4% |
| Colville | 0.0 /100 | #333 | Tragic 30.5% |
| Alaska Natives | 0.0 /100 | #334 | Tragic 30.6% |
| Cheyenne | 0.0 /100 | #335 | Tragic 31.1% |
| Yuman | 0.0 /100 | #336 | Tragic 31.5% |
| Houma | 0.0 /100 | #337 | Tragic 32.3% |
| Alaskan Athabascans | 0.0 /100 | #338 | Tragic 32.4% |