Immigrants from Congo vs Apache Disability Age 65 to 74
COMPARE
Immigrants from Congo
Apache
Disability Age 65 to 74
Disability Age 65 to 74 Comparison
Immigrants from Congo
Apache
26.0%
DISABILITY AGE 65 TO 74
0.0/ 100
METRIC RATING
285th/ 347
METRIC RANK
29.7%
DISABILITY AGE 65 TO 74
0.0/ 100
METRIC RATING
327th/ 347
METRIC RANK
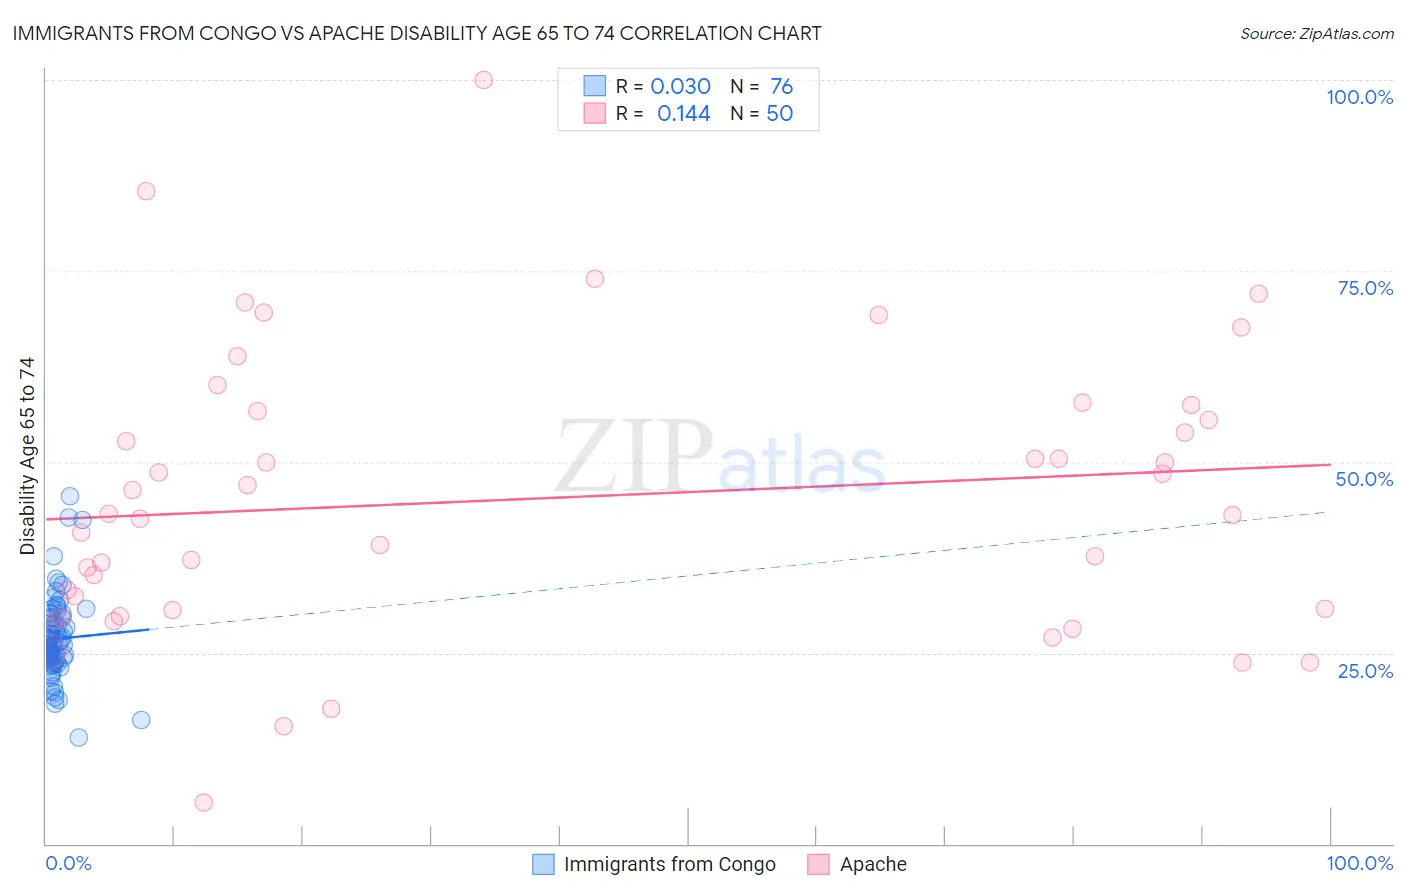
Immigrants from Congo vs Apache Disability Age 65 to 74 Correlation Chart
The statistical analysis conducted on geographies consisting of 92,066,096 people shows no correlation between the proportion of Immigrants from Congo and percentage of population with a disability between the ages 65 and 75 in the United States with a correlation coefficient (R) of 0.030 and weighted average of 26.0%. Similarly, the statistical analysis conducted on geographies consisting of 230,808,066 people shows a poor positive correlation between the proportion of Apache and percentage of population with a disability between the ages 65 and 75 in the United States with a correlation coefficient (R) of 0.144 and weighted average of 29.7%, a difference of 14.1%.
Disability Age 65 to 74 Correlation Summary
| Measurement | Immigrants from Congo | Apache |
| Minimum | 14.0% | 5.4% |
| Maximum | 45.5% | 100.0% |
| Range | 31.5% | 94.6% |
| Mean | 26.8% | 45.2% |
| Median | 26.1% | 43.2% |
| Interquartile 25% (IQ1) | 24.0% | 30.6% |
| Interquartile 75% (IQ3) | 29.6% | 56.6% |
| Interquartile Range (IQR) | 5.6% | 26.0% |
| Standard Deviation (Sample) | 5.4% | 18.7% |
| Standard Deviation (Population) | 5.4% | 18.6% |
Similar Demographics by Disability Age 65 to 74
Demographics Similar to Immigrants from Congo by Disability Age 65 to 74
In terms of disability age 65 to 74, the demographic groups most similar to Immigrants from Congo are Immigrants from the Azores (26.0%, a difference of 0.020%), Spanish American (25.9%, a difference of 0.21%), Delaware (25.9%, a difference of 0.35%), Immigrants from Honduras (25.9%, a difference of 0.42%), and Immigrants from Micronesia (26.1%, a difference of 0.43%).
| Demographics | Rating | Rank | Disability Age 65 to 74 |
| Immigrants | Belize | 0.1 /100 | #278 | Tragic 25.8% |
| U.S. Virgin Islanders | 0.1 /100 | #279 | Tragic 25.9% |
| Cree | 0.1 /100 | #280 | Tragic 25.9% |
| Immigrants | Honduras | 0.1 /100 | #281 | Tragic 25.9% |
| Delaware | 0.1 /100 | #282 | Tragic 25.9% |
| Spanish Americans | 0.0 /100 | #283 | Tragic 25.9% |
| Immigrants | Azores | 0.0 /100 | #284 | Tragic 26.0% |
| Immigrants | Congo | 0.0 /100 | #285 | Tragic 26.0% |
| Immigrants | Micronesia | 0.0 /100 | #286 | Tragic 26.1% |
| Immigrants | Laos | 0.0 /100 | #287 | Tragic 26.1% |
| Mexican American Indians | 0.0 /100 | #288 | Tragic 26.2% |
| Africans | 0.0 /100 | #289 | Tragic 26.2% |
| Immigrants | Cabo Verde | 0.0 /100 | #290 | Tragic 26.3% |
| Spanish American Indians | 0.0 /100 | #291 | Tragic 26.4% |
| Blackfeet | 0.0 /100 | #292 | Tragic 26.6% |
Demographics Similar to Apache by Disability Age 65 to 74
In terms of disability age 65 to 74, the demographic groups most similar to Apache are Yakama (29.6%, a difference of 0.16%), Dutch West Indian (29.6%, a difference of 0.38%), Seminole (29.4%, a difference of 0.83%), Hopi (30.0%, a difference of 0.94%), and Choctaw (30.2%, a difference of 1.8%).
| Demographics | Rating | Rank | Disability Age 65 to 74 |
| Cherokee | 0.0 /100 | #320 | Tragic 28.2% |
| Comanche | 0.0 /100 | #321 | Tragic 28.3% |
| Aleuts | 0.0 /100 | #322 | Tragic 28.4% |
| Puerto Ricans | 0.0 /100 | #323 | Tragic 29.1% |
| Seminole | 0.0 /100 | #324 | Tragic 29.4% |
| Dutch West Indians | 0.0 /100 | #325 | Tragic 29.6% |
| Yakama | 0.0 /100 | #326 | Tragic 29.6% |
| Apache | 0.0 /100 | #327 | Tragic 29.7% |
| Hopi | 0.0 /100 | #328 | Tragic 30.0% |
| Choctaw | 0.0 /100 | #329 | Tragic 30.2% |
| Creek | 0.0 /100 | #330 | Tragic 30.2% |
| Chickasaw | 0.0 /100 | #331 | Tragic 30.2% |
| Natives/Alaskans | 0.0 /100 | #332 | Tragic 30.4% |
| Colville | 0.0 /100 | #333 | Tragic 30.5% |
| Alaska Natives | 0.0 /100 | #334 | Tragic 30.6% |