Cree vs Nicaraguan Female Disability
COMPARE
Cree
Nicaraguan
Female Disability
Female Disability Comparison
Cree
Nicaraguans
13.7%
FEMALE DISABILITY
0.0/ 100
METRIC RATING
308th/ 347
METRIC RANK
11.9%
FEMALE DISABILITY
95.2/ 100
METRIC RATING
130th/ 347
METRIC RANK
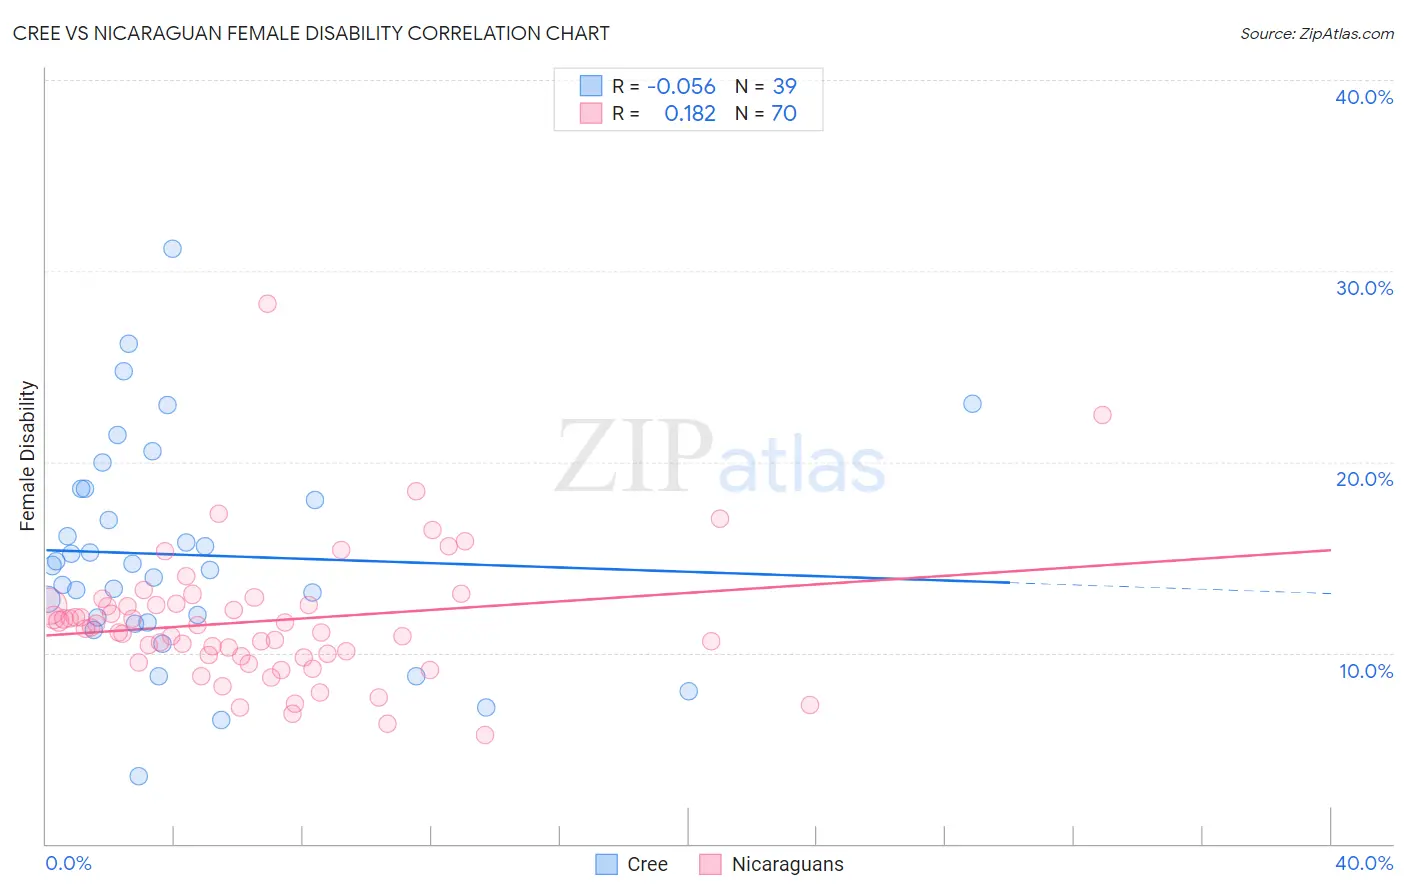
Cree vs Nicaraguan Female Disability Correlation Chart
The statistical analysis conducted on geographies consisting of 76,204,869 people shows a slight negative correlation between the proportion of Cree and percentage of females with a disability in the United States with a correlation coefficient (R) of -0.056 and weighted average of 13.7%. Similarly, the statistical analysis conducted on geographies consisting of 285,687,392 people shows a poor positive correlation between the proportion of Nicaraguans and percentage of females with a disability in the United States with a correlation coefficient (R) of 0.182 and weighted average of 11.9%, a difference of 15.4%.
Female Disability Correlation Summary
| Measurement | Cree | Nicaraguan |
| Minimum | 3.6% | 5.7% |
| Maximum | 31.2% | 28.3% |
| Range | 27.6% | 22.6% |
| Mean | 15.1% | 11.7% |
| Median | 14.6% | 11.3% |
| Interquartile 25% (IQ1) | 11.6% | 9.8% |
| Interquartile 75% (IQ3) | 18.6% | 12.5% |
| Interquartile Range (IQR) | 7.0% | 2.7% |
| Standard Deviation (Sample) | 5.7% | 3.5% |
| Standard Deviation (Population) | 5.6% | 3.5% |
Similar Demographics by Female Disability
Demographics Similar to Cree by Female Disability
In terms of female disability, the demographic groups most similar to Cree are French American Indian (13.7%, a difference of 0.060%), Apache (13.7%, a difference of 0.18%), Central American Indian (13.6%, a difference of 0.46%), Hopi (13.7%, a difference of 0.46%), and French Canadian (13.6%, a difference of 0.75%).
| Demographics | Rating | Rank | Female Disability |
| Africans | 0.0 /100 | #301 | Tragic 13.4% |
| Scotch-Irish | 0.0 /100 | #302 | Tragic 13.4% |
| Immigrants | Portugal | 0.0 /100 | #303 | Tragic 13.5% |
| Immigrants | Micronesia | 0.0 /100 | #304 | Tragic 13.5% |
| Dominicans | 0.0 /100 | #305 | Tragic 13.5% |
| French Canadians | 0.0 /100 | #306 | Tragic 13.6% |
| Central American Indians | 0.0 /100 | #307 | Tragic 13.6% |
| Cree | 0.0 /100 | #308 | Tragic 13.7% |
| French American Indians | 0.0 /100 | #309 | Tragic 13.7% |
| Apache | 0.0 /100 | #310 | Tragic 13.7% |
| Hopi | 0.0 /100 | #311 | Tragic 13.7% |
| Delaware | 0.0 /100 | #312 | Tragic 13.8% |
| Blackfeet | 0.0 /100 | #313 | Tragic 13.8% |
| Puget Sound Salish | 0.0 /100 | #314 | Tragic 13.8% |
| Alaskan Athabascans | 0.0 /100 | #315 | Tragic 13.9% |
Demographics Similar to Nicaraguans by Female Disability
In terms of female disability, the demographic groups most similar to Nicaraguans are Arab (11.9%, a difference of 0.030%), Macedonian (11.8%, a difference of 0.060%), Immigrants from Latvia (11.8%, a difference of 0.090%), Immigrants from Syria (11.9%, a difference of 0.12%), and South American Indian (11.8%, a difference of 0.13%).
| Demographics | Rating | Rank | Female Disability |
| Immigrants | Croatia | 96.7 /100 | #123 | Exceptional 11.8% |
| Russians | 96.5 /100 | #124 | Exceptional 11.8% |
| Immigrants | Italy | 96.4 /100 | #125 | Exceptional 11.8% |
| Immigrants | Europe | 96.2 /100 | #126 | Exceptional 11.8% |
| South American Indians | 95.8 /100 | #127 | Exceptional 11.8% |
| Immigrants | Latvia | 95.6 /100 | #128 | Exceptional 11.8% |
| Macedonians | 95.5 /100 | #129 | Exceptional 11.8% |
| Nicaraguans | 95.2 /100 | #130 | Exceptional 11.9% |
| Arabs | 95.1 /100 | #131 | Exceptional 11.9% |
| Immigrants | Syria | 94.6 /100 | #132 | Exceptional 11.9% |
| Kenyans | 94.5 /100 | #133 | Exceptional 11.9% |
| Immigrants | Nicaragua | 94.5 /100 | #134 | Exceptional 11.9% |
| Central Americans | 94.2 /100 | #135 | Exceptional 11.9% |
| Ugandans | 94.0 /100 | #136 | Exceptional 11.9% |
| Immigrants | Norway | 93.8 /100 | #137 | Exceptional 11.9% |