Native Hawaiian vs Immigrants from North America Vision Disability
COMPARE
Native Hawaiian
Immigrants from North America
Vision Disability
Vision Disability Comparison
Native Hawaiians
Immigrants from North America
2.2%
VISION DISABILITY
33.3/ 100
METRIC RATING
186th/ 347
METRIC RANK
2.2%
VISION DISABILITY
44.5/ 100
METRIC RATING
179th/ 347
METRIC RANK
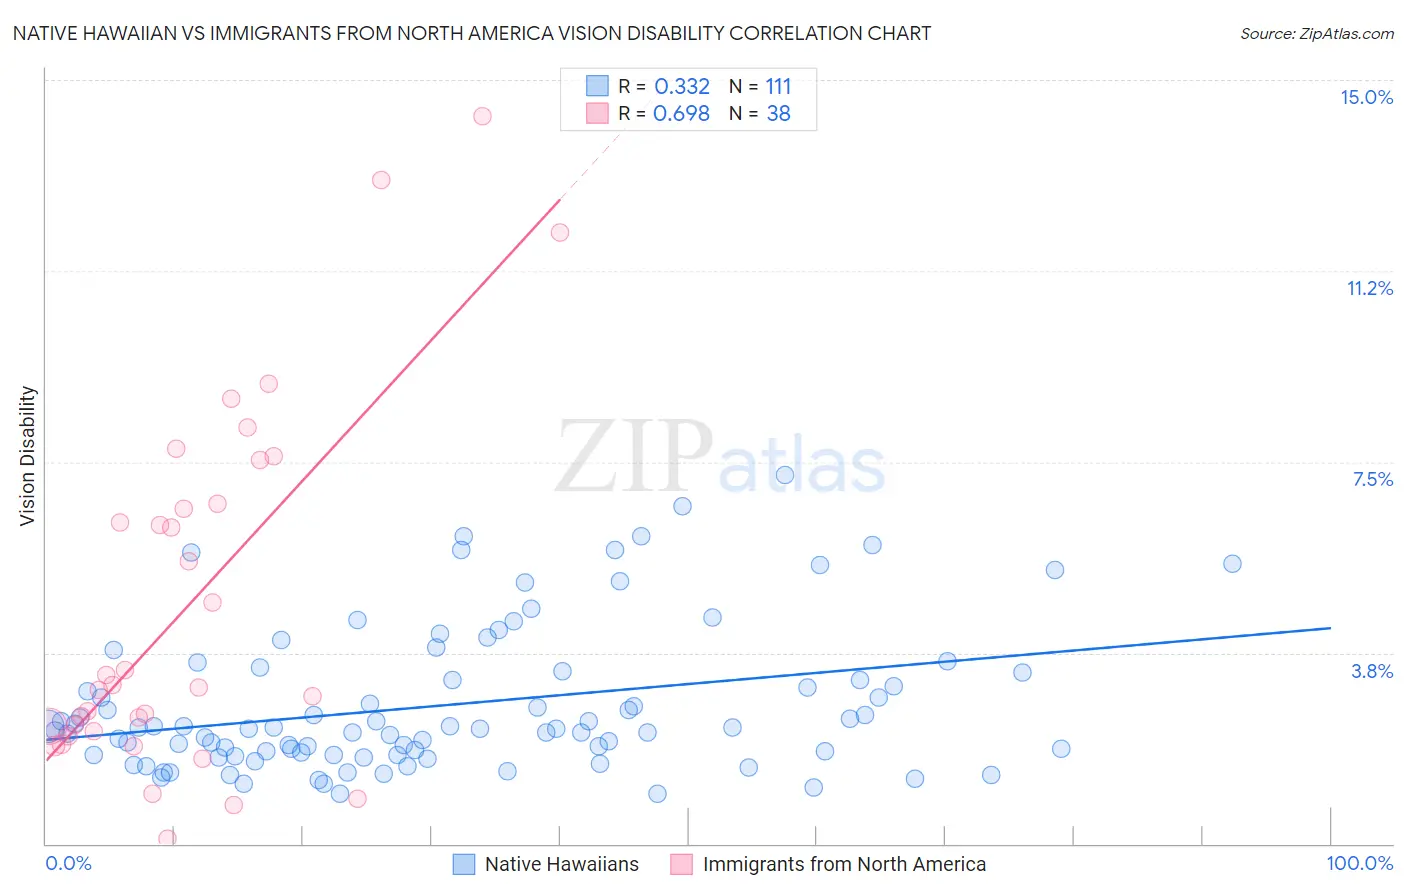
Native Hawaiian vs Immigrants from North America Vision Disability Correlation Chart
The statistical analysis conducted on geographies consisting of 331,807,196 people shows a mild positive correlation between the proportion of Native Hawaiians and percentage of population with vision disability in the United States with a correlation coefficient (R) of 0.332 and weighted average of 2.2%. Similarly, the statistical analysis conducted on geographies consisting of 461,875,281 people shows a significant positive correlation between the proportion of Immigrants from North America and percentage of population with vision disability in the United States with a correlation coefficient (R) of 0.698 and weighted average of 2.2%, a difference of 0.74%.
Vision Disability Correlation Summary
| Measurement | Native Hawaiian | Immigrants from North America |
| Minimum | 0.98% | 0.10% |
| Maximum | 7.3% | 14.3% |
| Range | 6.3% | 14.2% |
| Mean | 2.7% | 4.7% |
| Median | 2.3% | 3.1% |
| Interquartile 25% (IQ1) | 1.7% | 2.2% |
| Interquartile 75% (IQ3) | 3.4% | 6.7% |
| Interquartile Range (IQR) | 1.6% | 4.5% |
| Standard Deviation (Sample) | 1.4% | 3.5% |
| Standard Deviation (Population) | 1.4% | 3.5% |
Demographics Similar to Native Hawaiians and Immigrants from North America by Vision Disability
In terms of vision disability, the demographic groups most similar to Native Hawaiians are Immigrants from Middle Africa (2.2%, a difference of 0.020%), Moroccan (2.2%, a difference of 0.14%), Immigrants from St. Vincent and the Grenadines (2.2%, a difference of 0.22%), Immigrants from Burma/Myanmar (2.2%, a difference of 0.31%), and Guyanese (2.2%, a difference of 0.32%). Similarly, the demographic groups most similar to Immigrants from North America are Immigrants from Oceania (2.2%, a difference of 0.040%), Slavic (2.2%, a difference of 0.090%), Uruguayan (2.2%, a difference of 0.12%), Yugoslavian (2.2%, a difference of 0.13%), and Immigrants from Fiji (2.2%, a difference of 0.20%).
| Demographics | Rating | Rank | Vision Disability |
| Northern Europeans | 50.1 /100 | #172 | Average 2.2% |
| Scandinavians | 50.0 /100 | #173 | Average 2.2% |
| Immigrants | Canada | 50.0 /100 | #174 | Average 2.2% |
| Immigrants | Fiji | 47.6 /100 | #175 | Average 2.2% |
| Yugoslavians | 46.5 /100 | #176 | Average 2.2% |
| Slavs | 46.0 /100 | #177 | Average 2.2% |
| Immigrants | Oceania | 45.1 /100 | #178 | Average 2.2% |
| Immigrants | North America | 44.5 /100 | #179 | Average 2.2% |
| Uruguayans | 42.7 /100 | #180 | Average 2.2% |
| Immigrants | Western Europe | 41.1 /100 | #181 | Average 2.2% |
| Costa Ricans | 40.7 /100 | #182 | Average 2.2% |
| Immigrants | Burma/Myanmar | 37.9 /100 | #183 | Fair 2.2% |
| Moroccans | 35.4 /100 | #184 | Fair 2.2% |
| Immigrants | Middle Africa | 33.5 /100 | #185 | Fair 2.2% |
| Native Hawaiians | 33.3 /100 | #186 | Fair 2.2% |
| Immigrants | St. Vincent and the Grenadines | 30.3 /100 | #187 | Fair 2.2% |
| Guyanese | 28.9 /100 | #188 | Fair 2.2% |
| Salvadorans | 27.4 /100 | #189 | Fair 2.2% |
| Immigrants | Costa Rica | 26.1 /100 | #190 | Fair 2.2% |
| Canadians | 25.8 /100 | #191 | Fair 2.2% |
| Europeans | 25.7 /100 | #192 | Fair 2.2% |