Puget Sound Salish vs Immigrants from Iraq Cognitive Disability
COMPARE
Puget Sound Salish
Immigrants from Iraq
Cognitive Disability
Cognitive Disability Comparison
Puget Sound Salish
Immigrants from Iraq
17.5%
COGNITIVE DISABILITY
10.9/ 100
METRIC RATING
205th/ 347
METRIC RANK
17.8%
COGNITIVE DISABILITY
1.8/ 100
METRIC RATING
236th/ 347
METRIC RANK
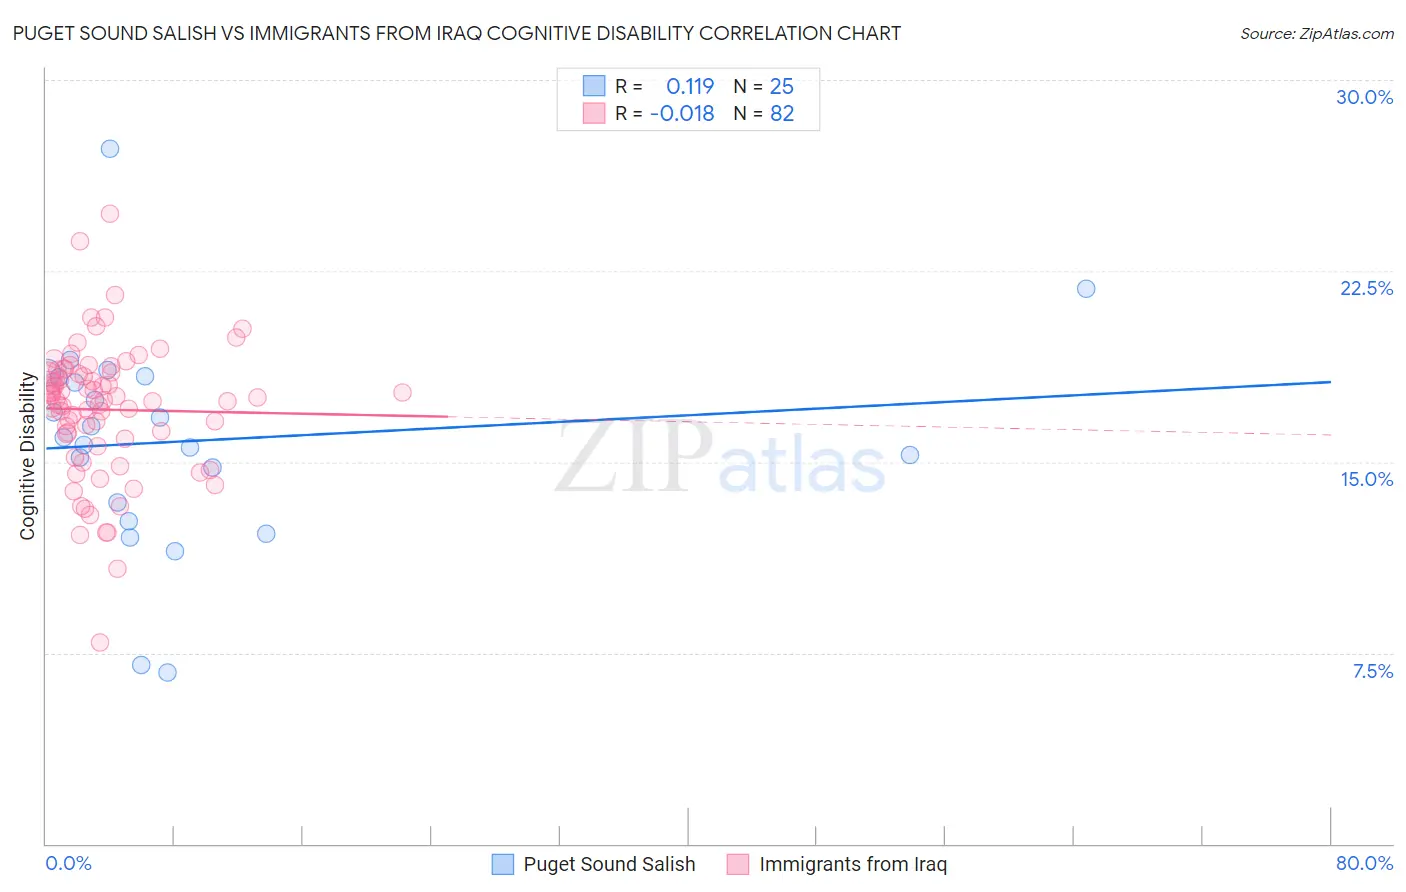
Puget Sound Salish vs Immigrants from Iraq Cognitive Disability Correlation Chart
The statistical analysis conducted on geographies consisting of 46,155,775 people shows a poor positive correlation between the proportion of Puget Sound Salish and percentage of population with cognitive disability in the United States with a correlation coefficient (R) of 0.119 and weighted average of 17.5%. Similarly, the statistical analysis conducted on geographies consisting of 194,729,131 people shows no correlation between the proportion of Immigrants from Iraq and percentage of population with cognitive disability in the United States with a correlation coefficient (R) of -0.018 and weighted average of 17.8%, a difference of 1.3%.
Cognitive Disability Correlation Summary
| Measurement | Puget Sound Salish | Immigrants from Iraq |
| Minimum | 6.7% | 7.9% |
| Maximum | 27.3% | 24.7% |
| Range | 20.6% | 16.8% |
| Mean | 15.8% | 17.0% |
| Median | 16.0% | 17.4% |
| Interquartile 25% (IQ1) | 13.0% | 15.9% |
| Interquartile 75% (IQ3) | 18.3% | 18.5% |
| Interquartile Range (IQR) | 5.3% | 2.6% |
| Standard Deviation (Sample) | 4.3% | 2.7% |
| Standard Deviation (Population) | 4.2% | 2.6% |
Similar Demographics by Cognitive Disability
Demographics Similar to Puget Sound Salish by Cognitive Disability
In terms of cognitive disability, the demographic groups most similar to Puget Sound Salish are Immigrants from Caribbean (17.5%, a difference of 0.010%), Immigrants from Zimbabwe (17.5%, a difference of 0.010%), Alaska Native (17.5%, a difference of 0.040%), Immigrants from Morocco (17.5%, a difference of 0.080%), and Immigrants from Latin America (17.6%, a difference of 0.090%).
| Demographics | Rating | Rank | Cognitive Disability |
| Immigrants | Panama | 14.8 /100 | #198 | Poor 17.5% |
| Immigrants | Singapore | 14.3 /100 | #199 | Poor 17.5% |
| Haitians | 14.1 /100 | #200 | Poor 17.5% |
| South American Indians | 13.0 /100 | #201 | Poor 17.5% |
| Immigrants | Morocco | 12.0 /100 | #202 | Poor 17.5% |
| Immigrants | Caribbean | 11.0 /100 | #203 | Poor 17.5% |
| Immigrants | Zimbabwe | 11.0 /100 | #204 | Poor 17.5% |
| Puget Sound Salish | 10.9 /100 | #205 | Poor 17.5% |
| Alaska Natives | 10.4 /100 | #206 | Poor 17.5% |
| Immigrants | Latin America | 9.7 /100 | #207 | Tragic 17.6% |
| Immigrants | Cameroon | 9.3 /100 | #208 | Tragic 17.6% |
| Immigrants | Trinidad and Tobago | 8.7 /100 | #209 | Tragic 17.6% |
| Immigrants | Jamaica | 8.5 /100 | #210 | Tragic 17.6% |
| Taiwanese | 7.7 /100 | #211 | Tragic 17.6% |
| Immigrants | Oceania | 7.3 /100 | #212 | Tragic 17.6% |
Demographics Similar to Immigrants from Iraq by Cognitive Disability
In terms of cognitive disability, the demographic groups most similar to Immigrants from Iraq are Immigrants from Mexico (17.8%, a difference of 0.010%), Cheyenne (17.8%, a difference of 0.040%), Osage (17.8%, a difference of 0.060%), Spanish American Indian (17.8%, a difference of 0.060%), and Tongan (17.8%, a difference of 0.080%).
| Demographics | Rating | Rank | Cognitive Disability |
| Immigrants | Guatemala | 2.2 /100 | #229 | Tragic 17.7% |
| Mongolians | 2.2 /100 | #230 | Tragic 17.7% |
| Guatemalans | 2.1 /100 | #231 | Tragic 17.8% |
| Tongans | 2.1 /100 | #232 | Tragic 17.8% |
| Panamanians | 2.1 /100 | #233 | Tragic 17.8% |
| Osage | 2.0 /100 | #234 | Tragic 17.8% |
| Spanish American Indians | 2.0 /100 | #235 | Tragic 17.8% |
| Immigrants | Iraq | 1.8 /100 | #236 | Tragic 17.8% |
| Immigrants | Mexico | 1.8 /100 | #237 | Tragic 17.8% |
| Cheyenne | 1.7 /100 | #238 | Tragic 17.8% |
| Cajuns | 1.4 /100 | #239 | Tragic 17.8% |
| Iraqis | 1.4 /100 | #240 | Tragic 17.8% |
| Mexicans | 1.1 /100 | #241 | Tragic 17.8% |
| Paiute | 1.1 /100 | #242 | Tragic 17.8% |
| Immigrants | Bangladesh | 1.0 /100 | #243 | Tragic 17.8% |