Belizean vs Estonian Cognitive Disability
COMPARE
Belizean
Estonian
Cognitive Disability
Cognitive Disability Comparison
Belizeans
Estonians
18.0%
COGNITIVE DISABILITY
0.4/ 100
METRIC RATING
266th/ 347
METRIC RANK
16.7%
COGNITIVE DISABILITY
99.3/ 100
METRIC RATING
75th/ 347
METRIC RANK
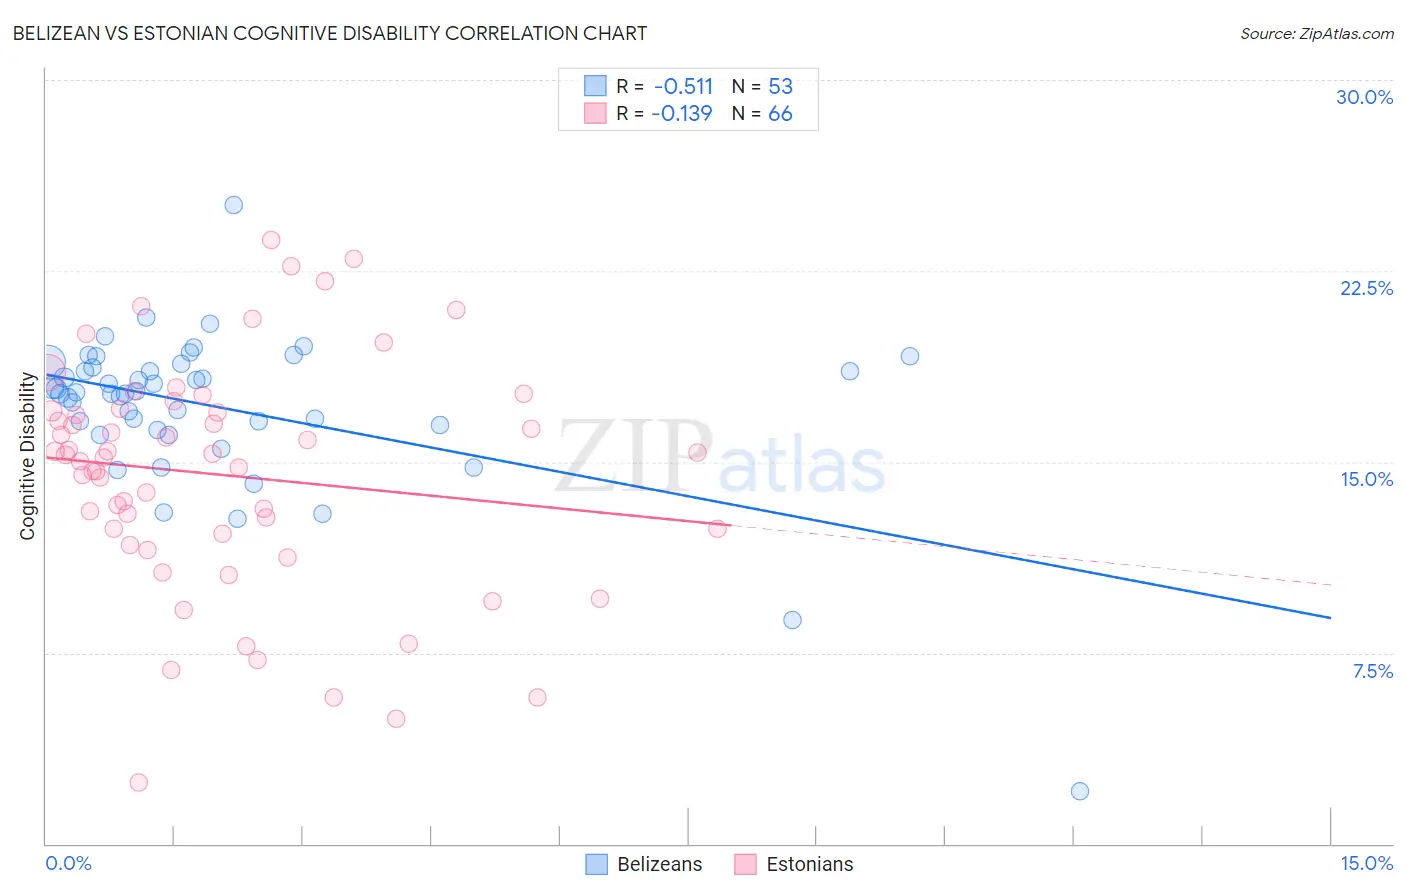
Belizean vs Estonian Cognitive Disability Correlation Chart
The statistical analysis conducted on geographies consisting of 144,188,092 people shows a substantial negative correlation between the proportion of Belizeans and percentage of population with cognitive disability in the United States with a correlation coefficient (R) of -0.511 and weighted average of 18.0%. Similarly, the statistical analysis conducted on geographies consisting of 123,512,744 people shows a poor negative correlation between the proportion of Estonians and percentage of population with cognitive disability in the United States with a correlation coefficient (R) of -0.139 and weighted average of 16.7%, a difference of 7.8%.
Cognitive Disability Correlation Summary
| Measurement | Belizean | Estonian |
| Minimum | 2.1% | 2.4% |
| Maximum | 25.1% | 23.7% |
| Range | 23.0% | 21.3% |
| Mean | 17.1% | 14.5% |
| Median | 17.7% | 15.2% |
| Interquartile 25% (IQ1) | 16.3% | 12.2% |
| Interquartile 75% (IQ3) | 18.8% | 17.0% |
| Interquartile Range (IQR) | 2.5% | 4.8% |
| Standard Deviation (Sample) | 3.2% | 4.5% |
| Standard Deviation (Population) | 3.2% | 4.5% |
Similar Demographics by Cognitive Disability
Demographics Similar to Belizeans by Cognitive Disability
In terms of cognitive disability, the demographic groups most similar to Belizeans are Spanish American (18.0%, a difference of 0.0%), Menominee (18.0%, a difference of 0.030%), Nepalese (18.0%, a difference of 0.060%), Cherokee (18.0%, a difference of 0.070%), and Immigrants from Barbados (17.9%, a difference of 0.090%).
| Demographics | Rating | Rank | Cognitive Disability |
| Ethiopians | 0.5 /100 | #259 | Tragic 17.9% |
| Immigrants | Belize | 0.5 /100 | #260 | Tragic 17.9% |
| Guamanians/Chamorros | 0.5 /100 | #261 | Tragic 17.9% |
| Sierra Leoneans | 0.4 /100 | #262 | Tragic 17.9% |
| Immigrants | Barbados | 0.4 /100 | #263 | Tragic 17.9% |
| Menominee | 0.4 /100 | #264 | Tragic 18.0% |
| Spanish Americans | 0.4 /100 | #265 | Tragic 18.0% |
| Belizeans | 0.4 /100 | #266 | Tragic 18.0% |
| Nepalese | 0.3 /100 | #267 | Tragic 18.0% |
| Cherokee | 0.3 /100 | #268 | Tragic 18.0% |
| Hondurans | 0.3 /100 | #269 | Tragic 18.0% |
| Immigrants | Bahamas | 0.3 /100 | #270 | Tragic 18.0% |
| Potawatomi | 0.2 /100 | #271 | Tragic 18.0% |
| Immigrants | Honduras | 0.2 /100 | #272 | Tragic 18.0% |
| Immigrants | Nepal | 0.2 /100 | #273 | Tragic 18.0% |
Demographics Similar to Estonians by Cognitive Disability
In terms of cognitive disability, the demographic groups most similar to Estonians are Burmese (16.7%, a difference of 0.010%), Slavic (16.7%, a difference of 0.010%), German (16.7%, a difference of 0.020%), Immigrants from Serbia (16.7%, a difference of 0.020%), and Immigrants from Belgium (16.7%, a difference of 0.030%).
| Demographics | Rating | Rank | Cognitive Disability |
| Ukrainians | 99.4 /100 | #68 | Exceptional 16.6% |
| Immigrants | Uzbekistan | 99.4 /100 | #69 | Exceptional 16.7% |
| Immigrants | Sweden | 99.4 /100 | #70 | Exceptional 16.7% |
| Immigrants | Belgium | 99.3 /100 | #71 | Exceptional 16.7% |
| Germans | 99.3 /100 | #72 | Exceptional 16.7% |
| Burmese | 99.3 /100 | #73 | Exceptional 16.7% |
| Slavs | 99.3 /100 | #74 | Exceptional 16.7% |
| Estonians | 99.3 /100 | #75 | Exceptional 16.7% |
| Immigrants | Serbia | 99.3 /100 | #76 | Exceptional 16.7% |
| Immigrants | Hungary | 99.3 /100 | #77 | Exceptional 16.7% |
| Peruvians | 99.3 /100 | #78 | Exceptional 16.7% |
| Immigrants | Bulgaria | 99.3 /100 | #79 | Exceptional 16.7% |
| Egyptians | 99.2 /100 | #80 | Exceptional 16.7% |
| Immigrants | Netherlands | 99.2 /100 | #81 | Exceptional 16.7% |
| Swiss | 99.2 /100 | #82 | Exceptional 16.7% |