Immigrants from Somalia vs Estonian Cognitive Disability
COMPARE
Immigrants from Somalia
Estonian
Cognitive Disability
Cognitive Disability Comparison
Immigrants from Somalia
Estonians
20.0%
COGNITIVE DISABILITY
0.0/ 100
METRIC RATING
347th/ 347
METRIC RANK
16.7%
COGNITIVE DISABILITY
99.3/ 100
METRIC RATING
75th/ 347
METRIC RANK
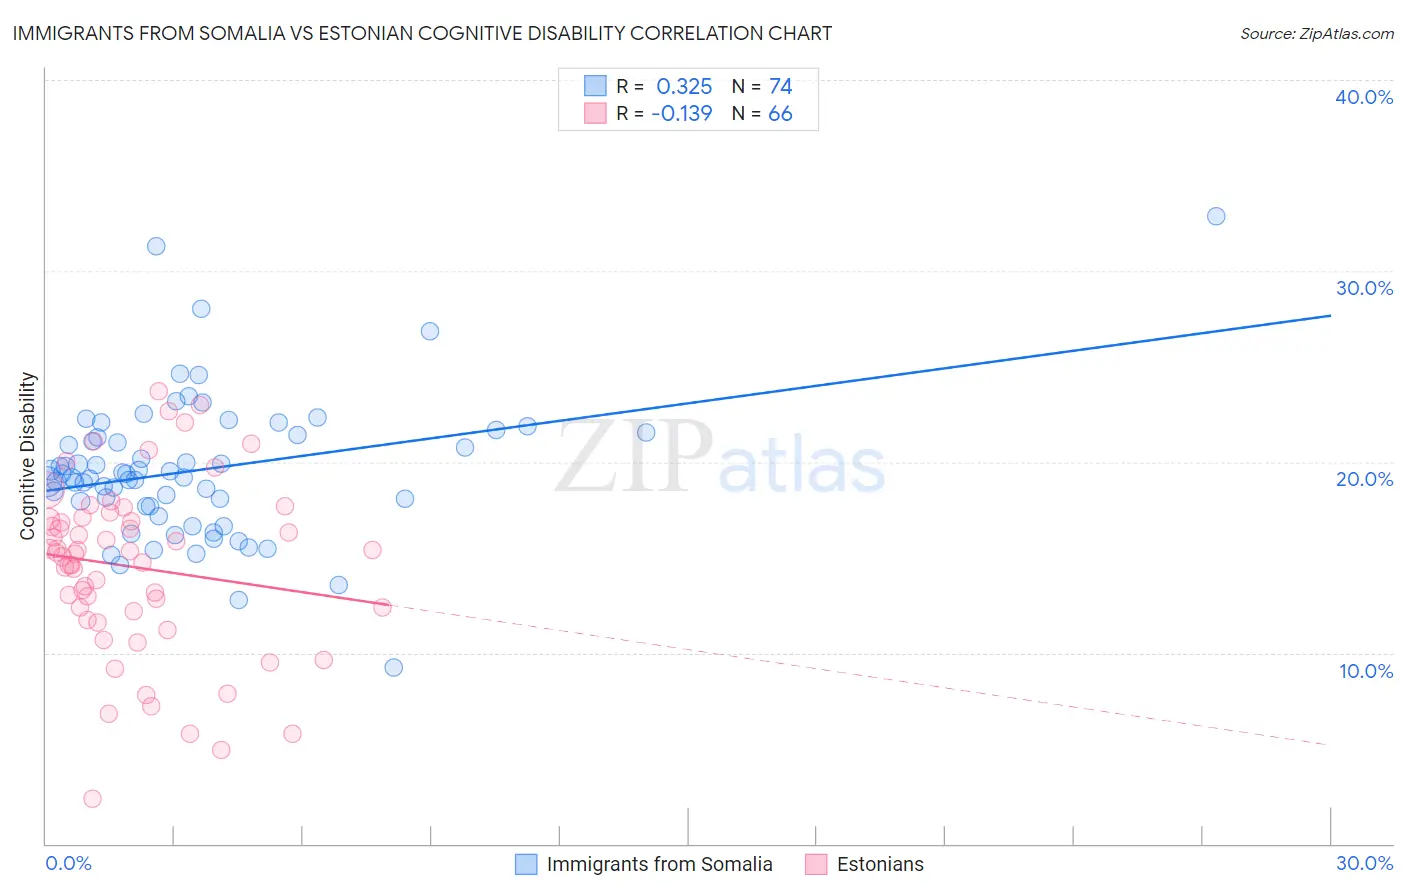
Immigrants from Somalia vs Estonian Cognitive Disability Correlation Chart
The statistical analysis conducted on geographies consisting of 92,095,793 people shows a mild positive correlation between the proportion of Immigrants from Somalia and percentage of population with cognitive disability in the United States with a correlation coefficient (R) of 0.325 and weighted average of 20.0%. Similarly, the statistical analysis conducted on geographies consisting of 123,512,744 people shows a poor negative correlation between the proportion of Estonians and percentage of population with cognitive disability in the United States with a correlation coefficient (R) of -0.139 and weighted average of 16.7%, a difference of 20.0%.
Cognitive Disability Correlation Summary
| Measurement | Immigrants from Somalia | Estonian |
| Minimum | 9.3% | 2.4% |
| Maximum | 32.8% | 23.7% |
| Range | 23.6% | 21.3% |
| Mean | 19.6% | 14.5% |
| Median | 19.3% | 15.2% |
| Interquartile 25% (IQ1) | 17.7% | 12.2% |
| Interquartile 75% (IQ3) | 21.4% | 17.0% |
| Interquartile Range (IQR) | 3.7% | 4.8% |
| Standard Deviation (Sample) | 3.7% | 4.5% |
| Standard Deviation (Population) | 3.7% | 4.5% |
Similar Demographics by Cognitive Disability
Demographics Similar to Immigrants from Somalia by Cognitive Disability
In terms of cognitive disability, the demographic groups most similar to Immigrants from Somalia are Immigrants from Cabo Verde (19.9%, a difference of 0.73%), Somali (19.8%, a difference of 0.89%), Immigrants from Congo (19.7%, a difference of 1.5%), Immigrants from Zaire (19.4%, a difference of 3.1%), and Tohono O'odham (19.3%, a difference of 3.8%).
| Demographics | Rating | Rank | Cognitive Disability |
| Immigrants | Yemen | 0.0 /100 | #333 | Tragic 18.8% |
| Sudanese | 0.0 /100 | #334 | Tragic 18.9% |
| Senegalese | 0.0 /100 | #335 | Tragic 19.0% |
| Blacks/African Americans | 0.0 /100 | #336 | Tragic 19.0% |
| Immigrants | Saudi Arabia | 0.0 /100 | #337 | Tragic 19.1% |
| Lumbee | 0.0 /100 | #338 | Tragic 19.1% |
| Puerto Ricans | 0.0 /100 | #339 | Tragic 19.2% |
| Cape Verdeans | 0.0 /100 | #340 | Tragic 19.2% |
| Tohono O'odham | 0.0 /100 | #341 | Tragic 19.3% |
| Houma | 0.0 /100 | #342 | Tragic 19.3% |
| Immigrants | Zaire | 0.0 /100 | #343 | Tragic 19.4% |
| Immigrants | Congo | 0.0 /100 | #344 | Tragic 19.7% |
| Somalis | 0.0 /100 | #345 | Tragic 19.8% |
| Immigrants | Cabo Verde | 0.0 /100 | #346 | Tragic 19.9% |
| Immigrants | Somalia | 0.0 /100 | #347 | Tragic 20.0% |
Demographics Similar to Estonians by Cognitive Disability
In terms of cognitive disability, the demographic groups most similar to Estonians are Burmese (16.7%, a difference of 0.010%), Slavic (16.7%, a difference of 0.010%), German (16.7%, a difference of 0.020%), Immigrants from Serbia (16.7%, a difference of 0.020%), and Immigrants from Belgium (16.7%, a difference of 0.030%).
| Demographics | Rating | Rank | Cognitive Disability |
| Ukrainians | 99.4 /100 | #68 | Exceptional 16.6% |
| Immigrants | Uzbekistan | 99.4 /100 | #69 | Exceptional 16.7% |
| Immigrants | Sweden | 99.4 /100 | #70 | Exceptional 16.7% |
| Immigrants | Belgium | 99.3 /100 | #71 | Exceptional 16.7% |
| Germans | 99.3 /100 | #72 | Exceptional 16.7% |
| Burmese | 99.3 /100 | #73 | Exceptional 16.7% |
| Slavs | 99.3 /100 | #74 | Exceptional 16.7% |
| Estonians | 99.3 /100 | #75 | Exceptional 16.7% |
| Immigrants | Serbia | 99.3 /100 | #76 | Exceptional 16.7% |
| Immigrants | Hungary | 99.3 /100 | #77 | Exceptional 16.7% |
| Peruvians | 99.3 /100 | #78 | Exceptional 16.7% |
| Immigrants | Bulgaria | 99.3 /100 | #79 | Exceptional 16.7% |
| Egyptians | 99.2 /100 | #80 | Exceptional 16.7% |
| Immigrants | Netherlands | 99.2 /100 | #81 | Exceptional 16.7% |
| Swiss | 99.2 /100 | #82 | Exceptional 16.7% |