Comanche vs Immigrants from Caribbean Ambulatory Disability
COMPARE
Comanche
Immigrants from Caribbean
Ambulatory Disability
Ambulatory Disability Comparison
Comanche
Immigrants from Caribbean
7.5%
AMBULATORY DISABILITY
0.0/ 100
METRIC RATING
325th/ 347
METRIC RANK
6.7%
AMBULATORY DISABILITY
0.0/ 100
METRIC RATING
279th/ 347
METRIC RANK
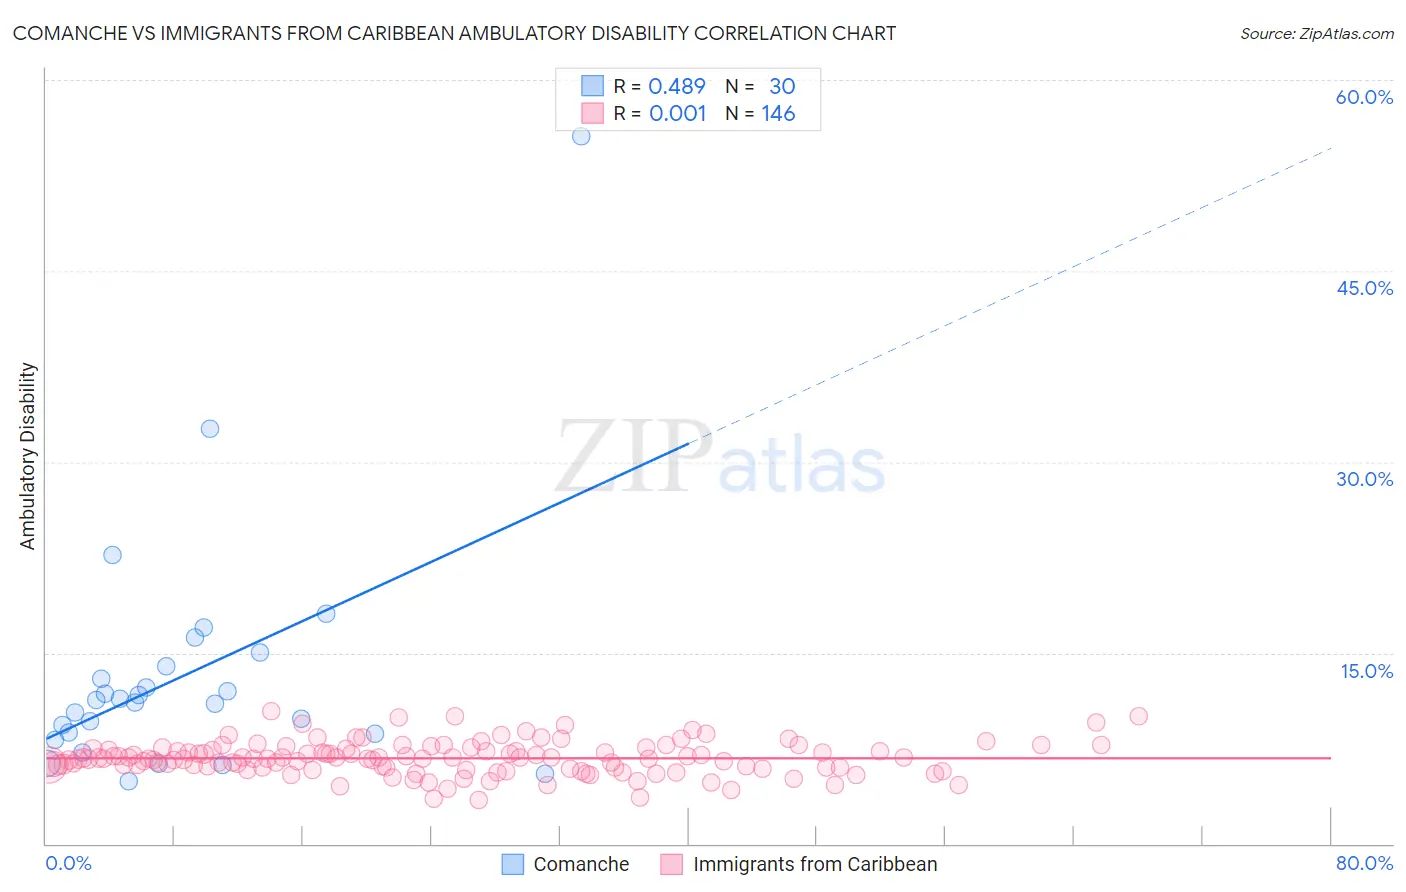
Comanche vs Immigrants from Caribbean Ambulatory Disability Correlation Chart
The statistical analysis conducted on geographies consisting of 109,774,668 people shows a moderate positive correlation between the proportion of Comanche and percentage of population with ambulatory disability in the United States with a correlation coefficient (R) of 0.489 and weighted average of 7.5%. Similarly, the statistical analysis conducted on geographies consisting of 449,814,526 people shows no correlation between the proportion of Immigrants from Caribbean and percentage of population with ambulatory disability in the United States with a correlation coefficient (R) of 0.001 and weighted average of 6.7%, a difference of 11.4%.
Ambulatory Disability Correlation Summary
| Measurement | Comanche | Immigrants from Caribbean |
| Minimum | 4.9% | 3.4% |
| Maximum | 55.6% | 10.4% |
| Range | 50.6% | 7.0% |
| Mean | 13.3% | 6.7% |
| Median | 11.2% | 6.7% |
| Interquartile 25% (IQ1) | 8.6% | 6.0% |
| Interquartile 75% (IQ3) | 13.9% | 7.4% |
| Interquartile Range (IQR) | 5.3% | 1.4% |
| Standard Deviation (Sample) | 9.7% | 1.3% |
| Standard Deviation (Population) | 9.6% | 1.3% |
Similar Demographics by Ambulatory Disability
Demographics Similar to Comanche by Ambulatory Disability
In terms of ambulatory disability, the demographic groups most similar to Comanche are Navajo (7.5%, a difference of 0.070%), Black/African American (7.5%, a difference of 0.11%), Native/Alaskan (7.5%, a difference of 0.12%), Hopi (7.6%, a difference of 1.1%), and Pueblo (7.6%, a difference of 1.1%).
| Demographics | Rating | Rank | Ambulatory Disability |
| Ottawa | 0.0 /100 | #318 | Tragic 7.2% |
| Dominicans | 0.0 /100 | #319 | Tragic 7.2% |
| Potawatomi | 0.0 /100 | #320 | Tragic 7.3% |
| Apache | 0.0 /100 | #321 | Tragic 7.4% |
| Osage | 0.0 /100 | #322 | Tragic 7.4% |
| Americans | 0.0 /100 | #323 | Tragic 7.4% |
| Navajo | 0.0 /100 | #324 | Tragic 7.5% |
| Comanche | 0.0 /100 | #325 | Tragic 7.5% |
| Blacks/African Americans | 0.0 /100 | #326 | Tragic 7.5% |
| Natives/Alaskans | 0.0 /100 | #327 | Tragic 7.5% |
| Hopi | 0.0 /100 | #328 | Tragic 7.6% |
| Pueblo | 0.0 /100 | #329 | Tragic 7.6% |
| Paiute | 0.0 /100 | #330 | Tragic 7.7% |
| Cajuns | 0.0 /100 | #331 | Tragic 7.8% |
| Menominee | 0.0 /100 | #332 | Tragic 7.8% |
Demographics Similar to Immigrants from Caribbean by Ambulatory Disability
In terms of ambulatory disability, the demographic groups most similar to Immigrants from Caribbean are Pennsylvania German (6.8%, a difference of 0.10%), Yaqui (6.8%, a difference of 0.17%), Barbadian (6.8%, a difference of 0.30%), Immigrants from West Indies (6.7%, a difference of 0.31%), and Jamaican (6.7%, a difference of 0.39%).
| Demographics | Rating | Rank | Ambulatory Disability |
| French Canadians | 0.1 /100 | #272 | Tragic 6.7% |
| Whites/Caucasians | 0.1 /100 | #273 | Tragic 6.7% |
| Sioux | 0.1 /100 | #274 | Tragic 6.7% |
| Immigrants | Guyana | 0.1 /100 | #275 | Tragic 6.7% |
| Celtics | 0.1 /100 | #276 | Tragic 6.7% |
| Jamaicans | 0.1 /100 | #277 | Tragic 6.7% |
| Immigrants | West Indies | 0.1 /100 | #278 | Tragic 6.7% |
| Immigrants | Caribbean | 0.0 /100 | #279 | Tragic 6.7% |
| Pennsylvania Germans | 0.0 /100 | #280 | Tragic 6.8% |
| Yaqui | 0.0 /100 | #281 | Tragic 6.8% |
| Barbadians | 0.0 /100 | #282 | Tragic 6.8% |
| Immigrants | Barbados | 0.0 /100 | #283 | Tragic 6.8% |
| Immigrants | Jamaica | 0.0 /100 | #284 | Tragic 6.8% |
| Fijians | 0.0 /100 | #285 | Tragic 6.8% |
| Yakama | 0.0 /100 | #286 | Tragic 6.8% |