Venezuelan vs Immigrants from Egypt Disability Age Over 75
COMPARE
Venezuelan
Immigrants from Egypt
Disability Age Over 75
Disability Age Over 75 Comparison
Venezuelans
Immigrants from Egypt
46.9%
DISABILITY AGE OVER 75
85.0/ 100
METRIC RATING
144th/ 347
METRIC RANK
46.3%
DISABILITY AGE OVER 75
98.3/ 100
METRIC RATING
91st/ 347
METRIC RANK
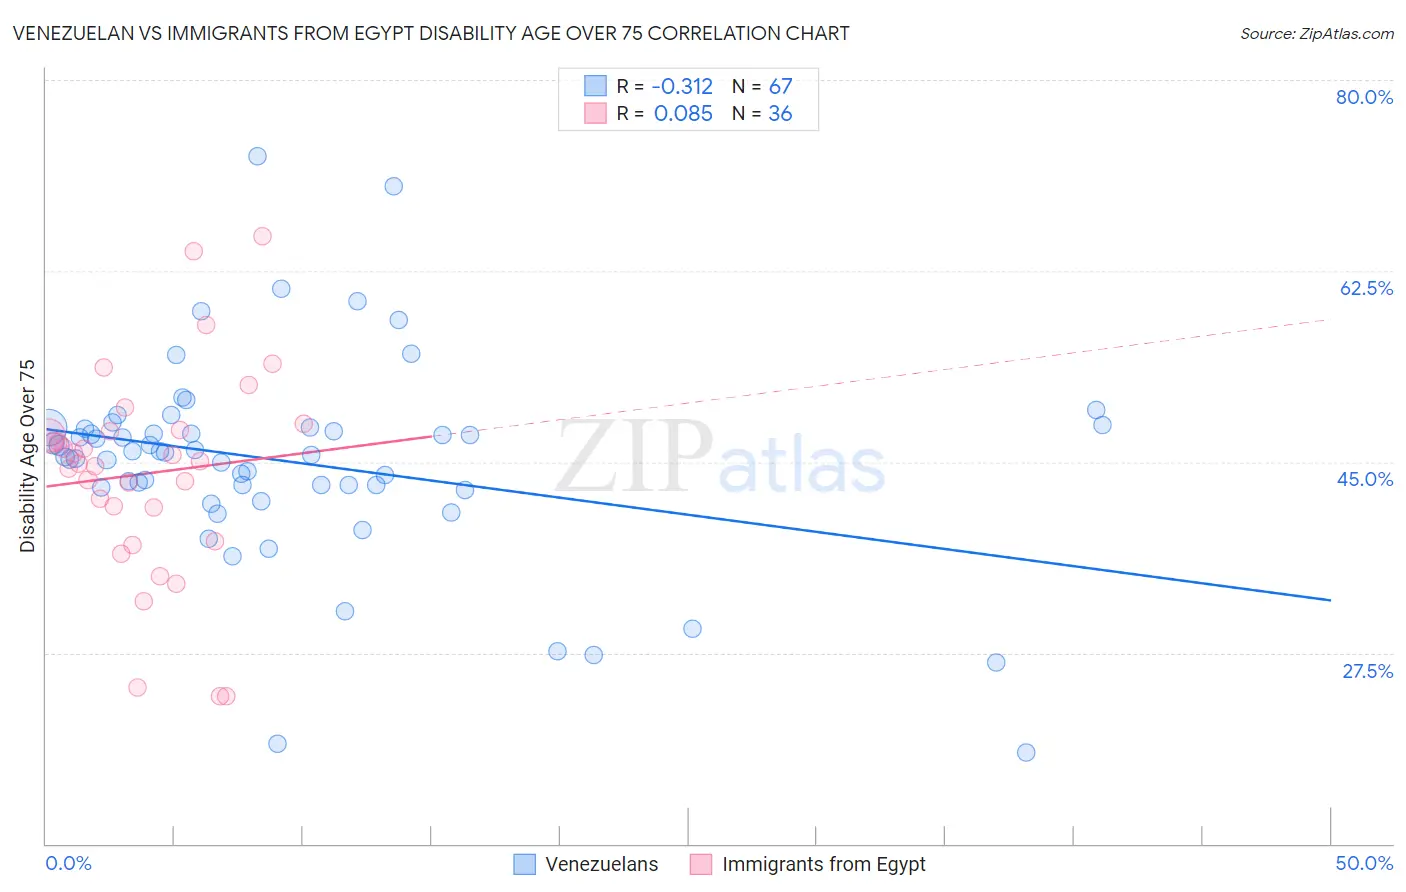
Venezuelan vs Immigrants from Egypt Disability Age Over 75 Correlation Chart
The statistical analysis conducted on geographies consisting of 305,815,180 people shows a mild negative correlation between the proportion of Venezuelans and percentage of population with a disability over the age of 75 in the United States with a correlation coefficient (R) of -0.312 and weighted average of 46.9%. Similarly, the statistical analysis conducted on geographies consisting of 245,335,222 people shows a slight positive correlation between the proportion of Immigrants from Egypt and percentage of population with a disability over the age of 75 in the United States with a correlation coefficient (R) of 0.085 and weighted average of 46.3%, a difference of 1.3%.
Disability Age Over 75 Correlation Summary
| Measurement | Venezuelan | Immigrants from Egypt |
| Minimum | 18.4% | 23.5% |
| Maximum | 73.0% | 65.6% |
| Range | 54.6% | 42.1% |
| Mean | 45.0% | 43.9% |
| Median | 45.9% | 45.0% |
| Interquartile 25% (IQ1) | 42.7% | 39.3% |
| Interquartile 75% (IQ3) | 48.1% | 47.9% |
| Interquartile Range (IQR) | 5.4% | 8.6% |
| Standard Deviation (Sample) | 9.4% | 9.5% |
| Standard Deviation (Population) | 9.3% | 9.4% |
Similar Demographics by Disability Age Over 75
Demographics Similar to Venezuelans by Disability Age Over 75
In terms of disability age over 75, the demographic groups most similar to Venezuelans are Bermudan (46.9%, a difference of 0.020%), Costa Rican (46.9%, a difference of 0.020%), Guyanese (46.9%, a difference of 0.030%), Immigrants from Peru (46.9%, a difference of 0.040%), and Peruvian (46.8%, a difference of 0.070%).
| Demographics | Rating | Rank | Disability Age Over 75 |
| Immigrants | Uganda | 88.5 /100 | #137 | Excellent 46.8% |
| Immigrants | Bosnia and Herzegovina | 88.5 /100 | #138 | Excellent 46.8% |
| Yugoslavians | 88.5 /100 | #139 | Excellent 46.8% |
| Immigrants | Costa Rica | 87.4 /100 | #140 | Excellent 46.8% |
| Lebanese | 87.0 /100 | #141 | Excellent 46.8% |
| Peruvians | 86.5 /100 | #142 | Excellent 46.8% |
| Bermudans | 85.6 /100 | #143 | Excellent 46.9% |
| Venezuelans | 85.0 /100 | #144 | Excellent 46.9% |
| Costa Ricans | 84.5 /100 | #145 | Excellent 46.9% |
| Guyanese | 84.3 /100 | #146 | Excellent 46.9% |
| Immigrants | Peru | 84.1 /100 | #147 | Excellent 46.9% |
| Asians | 81.6 /100 | #148 | Excellent 46.9% |
| Welsh | 81.3 /100 | #149 | Excellent 47.0% |
| Immigrants | Russia | 79.3 /100 | #150 | Good 47.0% |
| French Canadians | 79.0 /100 | #151 | Good 47.0% |
Demographics Similar to Immigrants from Egypt by Disability Age Over 75
In terms of disability age over 75, the demographic groups most similar to Immigrants from Egypt are Northern European (46.3%, a difference of 0.010%), Immigrants from Saudi Arabia (46.3%, a difference of 0.020%), Uruguayan (46.2%, a difference of 0.030%), German (46.3%, a difference of 0.050%), and Ugandan (46.3%, a difference of 0.050%).
| Demographics | Rating | Rank | Disability Age Over 75 |
| Immigrants | Jordan | 98.7 /100 | #84 | Exceptional 46.2% |
| Immigrants | Southern Europe | 98.6 /100 | #85 | Exceptional 46.2% |
| Romanians | 98.6 /100 | #86 | Exceptional 46.2% |
| Danes | 98.6 /100 | #87 | Exceptional 46.2% |
| Uruguayans | 98.4 /100 | #88 | Exceptional 46.2% |
| Immigrants | Saudi Arabia | 98.4 /100 | #89 | Exceptional 46.3% |
| Northern Europeans | 98.3 /100 | #90 | Exceptional 46.3% |
| Immigrants | Egypt | 98.3 /100 | #91 | Exceptional 46.3% |
| Germans | 98.2 /100 | #92 | Exceptional 46.3% |
| Ugandans | 98.2 /100 | #93 | Exceptional 46.3% |
| Albanians | 98.1 /100 | #94 | Exceptional 46.3% |
| Immigrants | Brazil | 98.0 /100 | #95 | Exceptional 46.3% |
| Immigrants | China | 98.0 /100 | #96 | Exceptional 46.3% |
| Finns | 97.9 /100 | #97 | Exceptional 46.3% |
| Immigrants | Japan | 97.8 /100 | #98 | Exceptional 46.3% |