Salvadoran vs Immigrants from Egypt Disability Age Over 75
COMPARE
Salvadoran
Immigrants from Egypt
Disability Age Over 75
Disability Age Over 75 Comparison
Salvadorans
Immigrants from Egypt
48.9%
DISABILITY AGE OVER 75
0.3/ 100
METRIC RATING
263rd/ 347
METRIC RANK
46.3%
DISABILITY AGE OVER 75
98.3/ 100
METRIC RATING
91st/ 347
METRIC RANK
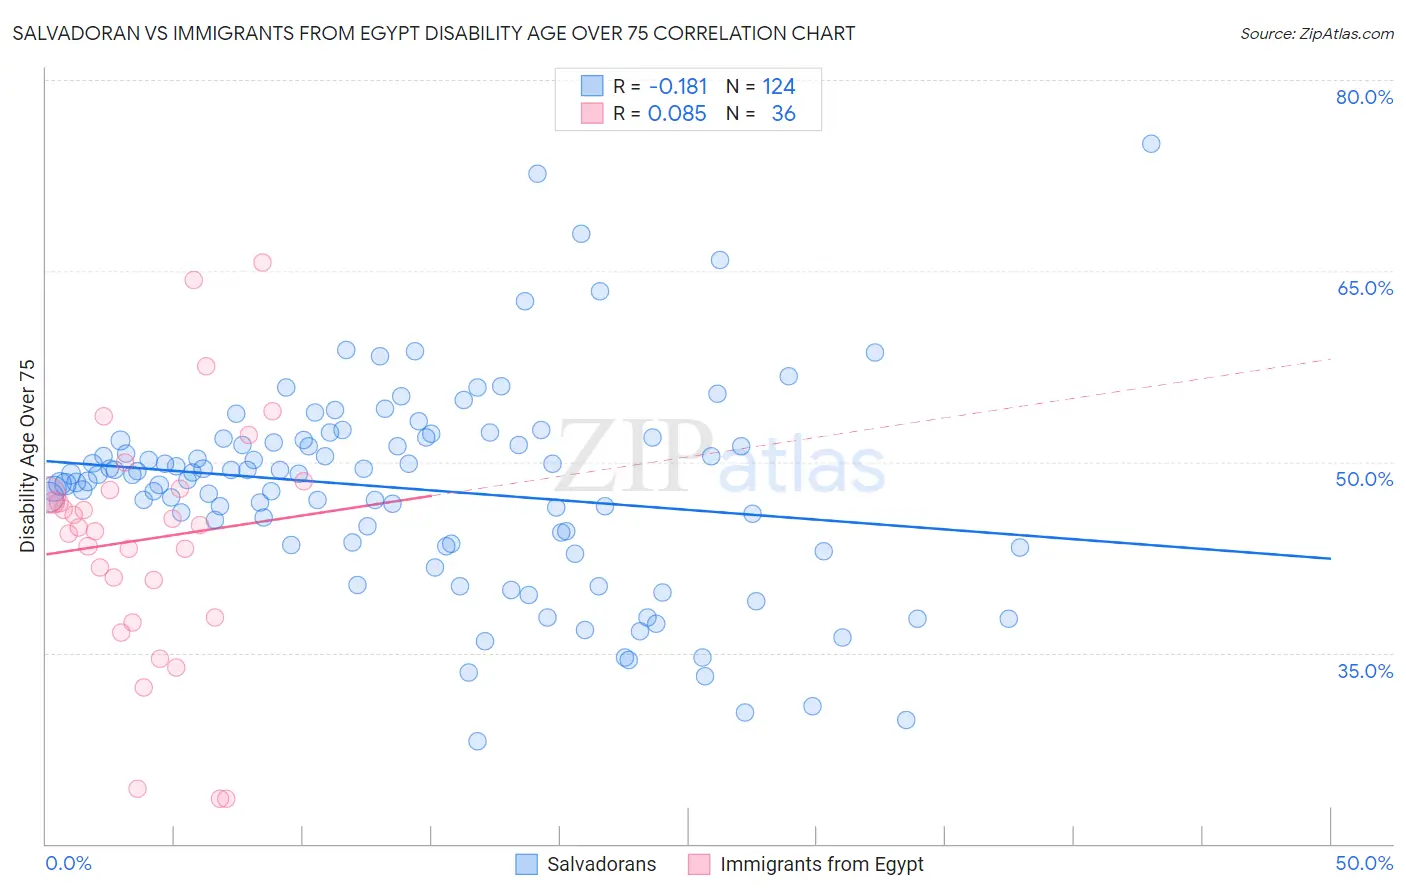
Salvadoran vs Immigrants from Egypt Disability Age Over 75 Correlation Chart
The statistical analysis conducted on geographies consisting of 398,055,900 people shows a poor negative correlation between the proportion of Salvadorans and percentage of population with a disability over the age of 75 in the United States with a correlation coefficient (R) of -0.181 and weighted average of 48.9%. Similarly, the statistical analysis conducted on geographies consisting of 245,335,222 people shows a slight positive correlation between the proportion of Immigrants from Egypt and percentage of population with a disability over the age of 75 in the United States with a correlation coefficient (R) of 0.085 and weighted average of 46.3%, a difference of 5.7%.
Disability Age Over 75 Correlation Summary
| Measurement | Salvadoran | Immigrants from Egypt |
| Minimum | 28.0% | 23.5% |
| Maximum | 75.0% | 65.6% |
| Range | 47.0% | 42.1% |
| Mean | 47.8% | 43.9% |
| Median | 49.0% | 45.0% |
| Interquartile 25% (IQ1) | 43.5% | 39.3% |
| Interquartile 75% (IQ3) | 51.7% | 47.9% |
| Interquartile Range (IQR) | 8.2% | 8.6% |
| Standard Deviation (Sample) | 8.1% | 9.5% |
| Standard Deviation (Population) | 8.0% | 9.4% |
Similar Demographics by Disability Age Over 75
Demographics Similar to Salvadorans by Disability Age Over 75
In terms of disability age over 75, the demographic groups most similar to Salvadorans are Immigrants from West Indies (48.9%, a difference of 0.020%), Immigrants from Honduras (48.9%, a difference of 0.050%), Honduran (48.9%, a difference of 0.060%), African (48.9%, a difference of 0.080%), and U.S. Virgin Islander (48.9%, a difference of 0.090%).
| Demographics | Rating | Rank | Disability Age Over 75 |
| Immigrants | Congo | 0.5 /100 | #256 | Tragic 48.7% |
| Blackfeet | 0.5 /100 | #257 | Tragic 48.8% |
| Immigrants | Philippines | 0.4 /100 | #258 | Tragic 48.8% |
| Central Americans | 0.4 /100 | #259 | Tragic 48.8% |
| Immigrants | Afghanistan | 0.4 /100 | #260 | Tragic 48.8% |
| Africans | 0.3 /100 | #261 | Tragic 48.9% |
| Immigrants | West Indies | 0.3 /100 | #262 | Tragic 48.9% |
| Salvadorans | 0.3 /100 | #263 | Tragic 48.9% |
| Immigrants | Honduras | 0.3 /100 | #264 | Tragic 48.9% |
| Hondurans | 0.3 /100 | #265 | Tragic 48.9% |
| U.S. Virgin Islanders | 0.2 /100 | #266 | Tragic 48.9% |
| Malaysians | 0.2 /100 | #267 | Tragic 49.0% |
| Guatemalans | 0.2 /100 | #268 | Tragic 49.0% |
| Immigrants | El Salvador | 0.2 /100 | #269 | Tragic 49.0% |
| Potawatomi | 0.2 /100 | #270 | Tragic 49.0% |
Demographics Similar to Immigrants from Egypt by Disability Age Over 75
In terms of disability age over 75, the demographic groups most similar to Immigrants from Egypt are Northern European (46.3%, a difference of 0.010%), Immigrants from Saudi Arabia (46.3%, a difference of 0.020%), Uruguayan (46.2%, a difference of 0.030%), German (46.3%, a difference of 0.050%), and Ugandan (46.3%, a difference of 0.050%).
| Demographics | Rating | Rank | Disability Age Over 75 |
| Immigrants | Jordan | 98.7 /100 | #84 | Exceptional 46.2% |
| Immigrants | Southern Europe | 98.6 /100 | #85 | Exceptional 46.2% |
| Romanians | 98.6 /100 | #86 | Exceptional 46.2% |
| Danes | 98.6 /100 | #87 | Exceptional 46.2% |
| Uruguayans | 98.4 /100 | #88 | Exceptional 46.2% |
| Immigrants | Saudi Arabia | 98.4 /100 | #89 | Exceptional 46.3% |
| Northern Europeans | 98.3 /100 | #90 | Exceptional 46.3% |
| Immigrants | Egypt | 98.3 /100 | #91 | Exceptional 46.3% |
| Germans | 98.2 /100 | #92 | Exceptional 46.3% |
| Ugandans | 98.2 /100 | #93 | Exceptional 46.3% |
| Albanians | 98.1 /100 | #94 | Exceptional 46.3% |
| Immigrants | Brazil | 98.0 /100 | #95 | Exceptional 46.3% |
| Immigrants | China | 98.0 /100 | #96 | Exceptional 46.3% |
| Finns | 97.9 /100 | #97 | Exceptional 46.3% |
| Immigrants | Japan | 97.8 /100 | #98 | Exceptional 46.3% |