Colville vs Immigrants from Micronesia In Labor Force | Age 16-19
COMPARE
Colville
Immigrants from Micronesia
In Labor Force | Age 16-19
In Labor Force | Age 16-19 Comparison
Colville
Immigrants from Micronesia
38.3%
IN LABOR FORCE | AGE 16-19
97.9/ 100
METRIC RATING
116th/ 347
METRIC RANK
40.2%
IN LABOR FORCE | AGE 16-19
100.0/ 100
METRIC RATING
64th/ 347
METRIC RANK
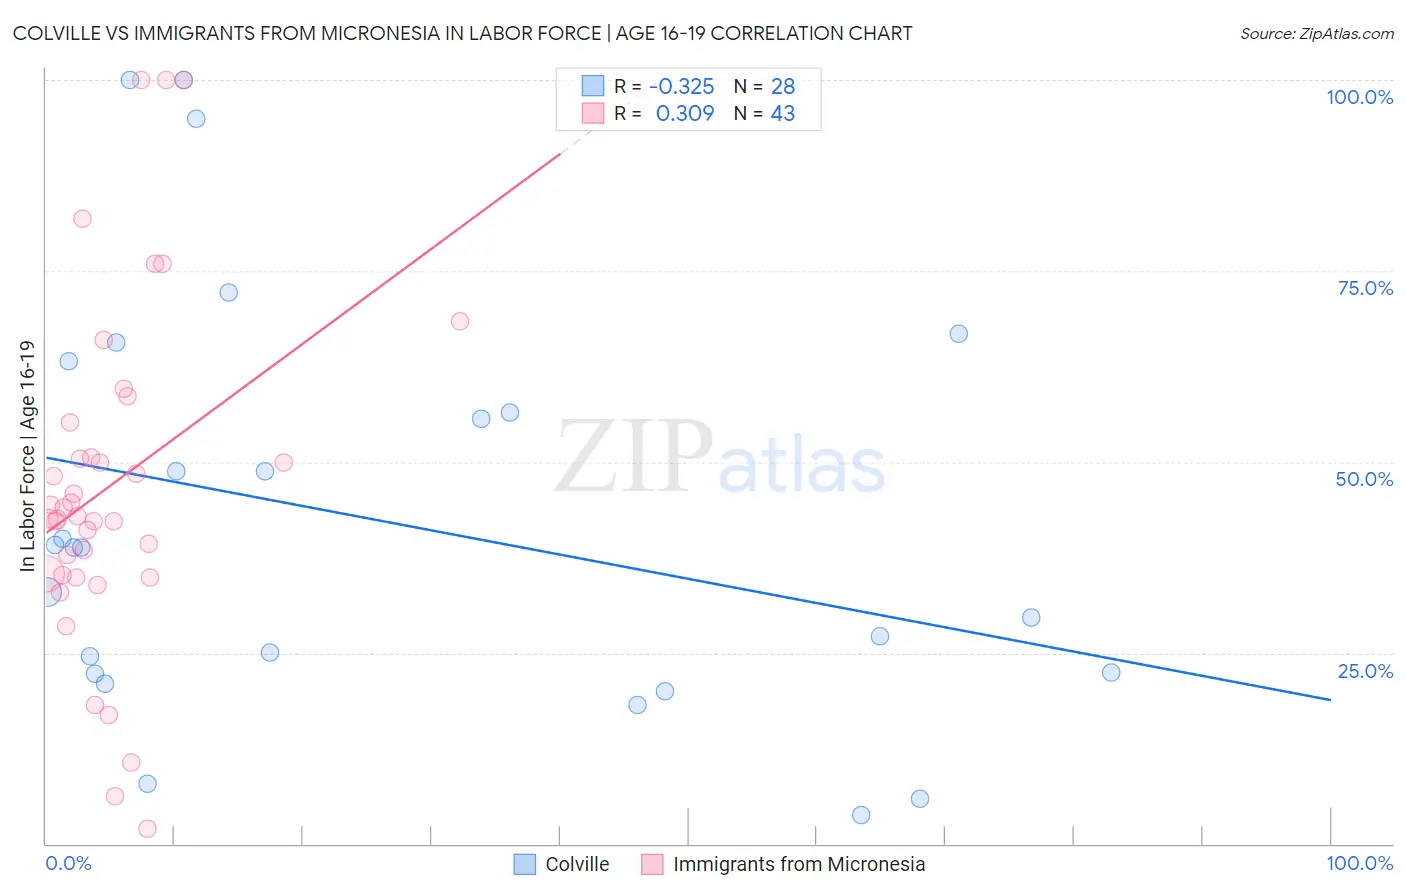
Colville vs Immigrants from Micronesia In Labor Force | Age 16-19 Correlation Chart
The statistical analysis conducted on geographies consisting of 34,676,086 people shows a mild negative correlation between the proportion of Colville and labor force participation rate among population between the ages 16 and 19 in the United States with a correlation coefficient (R) of -0.325 and weighted average of 38.3%. Similarly, the statistical analysis conducted on geographies consisting of 61,545,841 people shows a mild positive correlation between the proportion of Immigrants from Micronesia and labor force participation rate among population between the ages 16 and 19 in the United States with a correlation coefficient (R) of 0.309 and weighted average of 40.2%, a difference of 4.8%.
In Labor Force | Age 16-19 Correlation Summary
| Measurement | Colville | Immigrants from Micronesia |
| Minimum | 3.7% | 1.9% |
| Maximum | 100.0% | 100.0% |
| Range | 96.3% | 98.1% |
| Mean | 42.5% | 46.9% |
| Median | 38.8% | 42.9% |
| Interquartile 25% (IQ1) | 22.4% | 35.2% |
| Interquartile 75% (IQ3) | 59.8% | 55.2% |
| Interquartile Range (IQR) | 37.4% | 20.0% |
| Standard Deviation (Sample) | 27.1% | 22.3% |
| Standard Deviation (Population) | 26.6% | 22.1% |
Similar Demographics by In Labor Force | Age 16-19
Demographics Similar to Colville by In Labor Force | Age 16-19
In terms of in labor force | age 16-19, the demographic groups most similar to Colville are Bulgarian (38.3%, a difference of 0.010%), Chickasaw (38.3%, a difference of 0.050%), Immigrants from Nepal (38.3%, a difference of 0.060%), Assyrian/Chaldean/Syriac (38.3%, a difference of 0.080%), and Hawaiian (38.4%, a difference of 0.15%).
| Demographics | Rating | Rank | In Labor Force | Age 16-19 |
| Lebanese | 98.7 /100 | #109 | Exceptional 38.6% |
| Maltese | 98.6 /100 | #110 | Exceptional 38.5% |
| Crow | 98.5 /100 | #111 | Exceptional 38.5% |
| Immigrants | Scotland | 98.5 /100 | #112 | Exceptional 38.5% |
| Sub-Saharan Africans | 98.3 /100 | #113 | Exceptional 38.4% |
| Hawaiians | 98.2 /100 | #114 | Exceptional 38.4% |
| Bulgarians | 97.9 /100 | #115 | Exceptional 38.3% |
| Colville | 97.9 /100 | #116 | Exceptional 38.3% |
| Chickasaw | 97.8 /100 | #117 | Exceptional 38.3% |
| Immigrants | Nepal | 97.8 /100 | #118 | Exceptional 38.3% |
| Assyrians/Chaldeans/Syriacs | 97.8 /100 | #119 | Exceptional 38.3% |
| Ukrainians | 97.6 /100 | #120 | Exceptional 38.3% |
| Ethiopians | 97.4 /100 | #121 | Exceptional 38.2% |
| Guamanians/Chamorros | 97.4 /100 | #122 | Exceptional 38.2% |
| Seminole | 96.7 /100 | #123 | Exceptional 38.1% |
Demographics Similar to Immigrants from Micronesia by In Labor Force | Age 16-19
In terms of in labor force | age 16-19, the demographic groups most similar to Immigrants from Micronesia are Kenyan (40.1%, a difference of 0.080%), Northern European (40.2%, a difference of 0.12%), Cherokee (40.2%, a difference of 0.17%), Nonimmigrants (40.1%, a difference of 0.20%), and Canadian (40.1%, a difference of 0.21%).
| Demographics | Rating | Rank | In Labor Force | Age 16-19 |
| Lithuanians | 100.0 /100 | #57 | Exceptional 40.4% |
| Aleuts | 100.0 /100 | #58 | Exceptional 40.4% |
| Slavs | 100.0 /100 | #59 | Exceptional 40.4% |
| Immigrants | Eastern Africa | 100.0 /100 | #60 | Exceptional 40.4% |
| Americans | 100.0 /100 | #61 | Exceptional 40.3% |
| Cherokee | 100.0 /100 | #62 | Exceptional 40.2% |
| Northern Europeans | 100.0 /100 | #63 | Exceptional 40.2% |
| Immigrants | Micronesia | 100.0 /100 | #64 | Exceptional 40.2% |
| Kenyans | 100.0 /100 | #65 | Exceptional 40.1% |
| Immigrants | Nonimmigrants | 100.0 /100 | #66 | Exceptional 40.1% |
| Canadians | 100.0 /100 | #67 | Exceptional 40.1% |
| Italians | 99.9 /100 | #68 | Exceptional 40.1% |
| Potawatomi | 99.9 /100 | #69 | Exceptional 40.0% |
| Portuguese | 99.9 /100 | #70 | Exceptional 40.0% |
| Serbians | 99.9 /100 | #71 | Exceptional 39.9% |