Nonimmigrants vs Immigrants from Cabo Verde Cognitive Disability
COMPARE
Nonimmigrants
Immigrants from Cabo Verde
Cognitive Disability
Cognitive Disability Comparison
Nonimmigrants
Immigrants from Cabo Verde
17.4%
COGNITIVE DISABILITY
27.4/ 100
METRIC RATING
191st/ 347
METRIC RANK
19.9%
COGNITIVE DISABILITY
0.0/ 100
METRIC RATING
346th/ 347
METRIC RANK
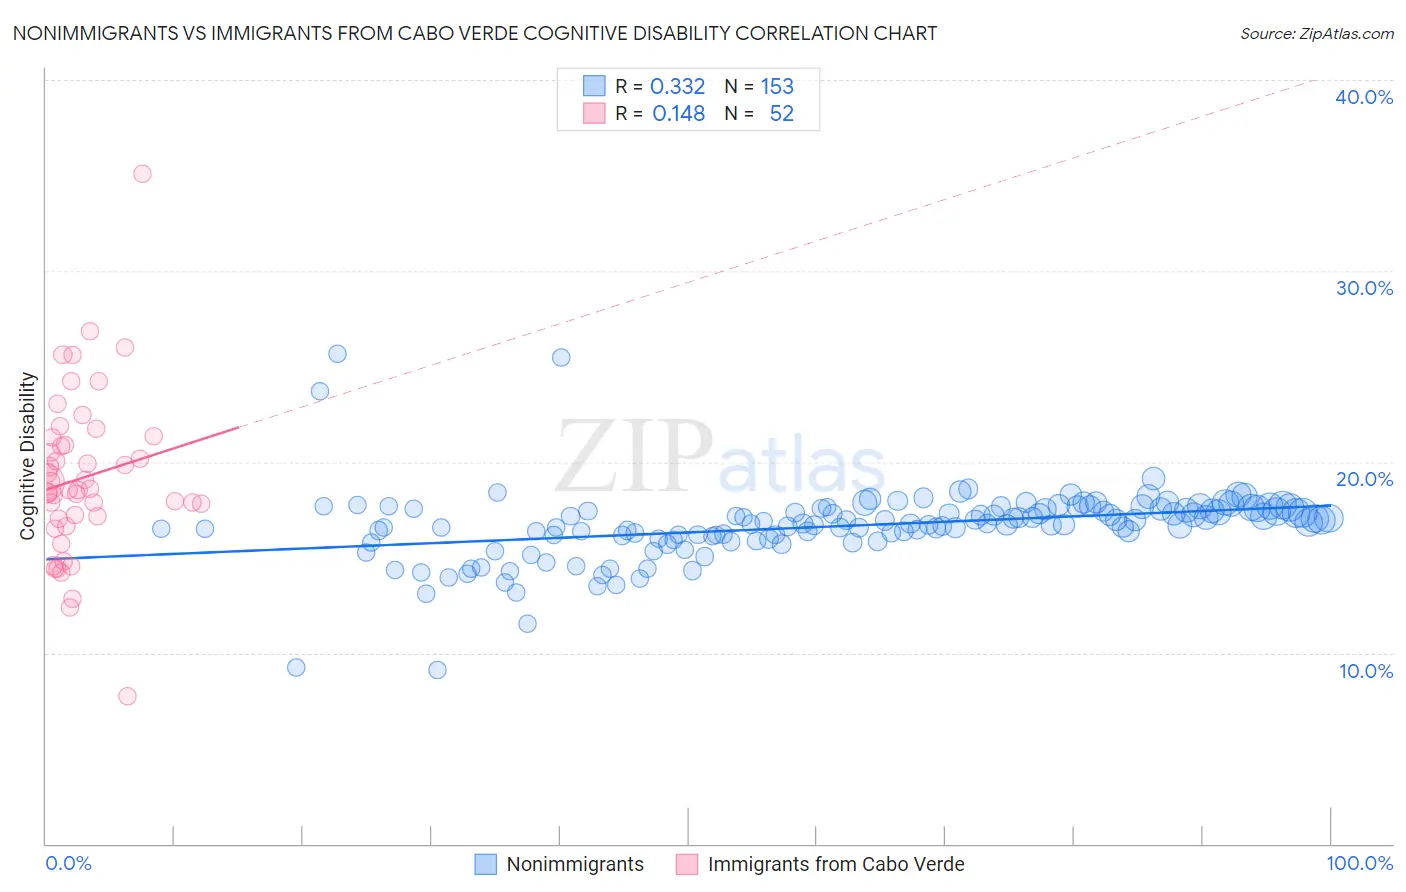
Nonimmigrants vs Immigrants from Cabo Verde Cognitive Disability Correlation Chart
The statistical analysis conducted on geographies consisting of 584,976,337 people shows a mild positive correlation between the proportion of Nonimmigrants and percentage of population with cognitive disability in the United States with a correlation coefficient (R) of 0.332 and weighted average of 17.4%. Similarly, the statistical analysis conducted on geographies consisting of 38,139,711 people shows a poor positive correlation between the proportion of Immigrants from Cabo Verde and percentage of population with cognitive disability in the United States with a correlation coefficient (R) of 0.148 and weighted average of 19.9%, a difference of 14.1%.
Cognitive Disability Correlation Summary
| Measurement | Nonimmigrants | Immigrants from Cabo Verde |
| Minimum | 9.1% | 7.7% |
| Maximum | 25.7% | 35.1% |
| Range | 16.6% | 27.4% |
| Mean | 16.6% | 19.2% |
| Median | 16.8% | 18.6% |
| Interquartile 25% (IQ1) | 16.0% | 17.1% |
| Interquartile 75% (IQ3) | 17.6% | 21.1% |
| Interquartile Range (IQR) | 1.5% | 4.0% |
| Standard Deviation (Sample) | 1.9% | 4.3% |
| Standard Deviation (Population) | 1.9% | 4.3% |
Similar Demographics by Cognitive Disability
Demographics Similar to Nonimmigrants by Cognitive Disability
In terms of cognitive disability, the demographic groups most similar to Nonimmigrants are Immigrants from Spain (17.4%, a difference of 0.010%), Immigrants from Haiti (17.4%, a difference of 0.010%), Delaware (17.4%, a difference of 0.060%), Immigrants from Western Asia (17.4%, a difference of 0.070%), and Immigrants from France (17.4%, a difference of 0.080%).
| Demographics | Rating | Rank | Cognitive Disability |
| Crow | 39.1 /100 | #184 | Fair 17.3% |
| Afghans | 38.2 /100 | #185 | Fair 17.3% |
| Cambodians | 35.9 /100 | #186 | Fair 17.3% |
| Immigrants | Fiji | 33.7 /100 | #187 | Fair 17.4% |
| Immigrants | France | 29.8 /100 | #188 | Fair 17.4% |
| Immigrants | Western Asia | 29.5 /100 | #189 | Fair 17.4% |
| Immigrants | Spain | 27.7 /100 | #190 | Fair 17.4% |
| Immigrants | Nonimmigrants | 27.4 /100 | #191 | Fair 17.4% |
| Immigrants | Haiti | 27.1 /100 | #192 | Fair 17.4% |
| Delaware | 25.6 /100 | #193 | Fair 17.4% |
| Immigrants | Bosnia and Herzegovina | 22.0 /100 | #194 | Fair 17.4% |
| New Zealanders | 21.1 /100 | #195 | Fair 17.4% |
| Guyanese | 17.5 /100 | #196 | Poor 17.5% |
| Immigrants | Afghanistan | 16.7 /100 | #197 | Poor 17.5% |
| Immigrants | Panama | 14.8 /100 | #198 | Poor 17.5% |
Demographics Similar to Immigrants from Cabo Verde by Cognitive Disability
In terms of cognitive disability, the demographic groups most similar to Immigrants from Cabo Verde are Somali (19.8%, a difference of 0.16%), Immigrants from Congo (19.7%, a difference of 0.72%), Immigrants from Somalia (20.0%, a difference of 0.73%), Immigrants from Zaire (19.4%, a difference of 2.4%), and Tohono O'odham (19.3%, a difference of 3.1%).
| Demographics | Rating | Rank | Cognitive Disability |
| Immigrants | Yemen | 0.0 /100 | #333 | Tragic 18.8% |
| Sudanese | 0.0 /100 | #334 | Tragic 18.9% |
| Senegalese | 0.0 /100 | #335 | Tragic 19.0% |
| Blacks/African Americans | 0.0 /100 | #336 | Tragic 19.0% |
| Immigrants | Saudi Arabia | 0.0 /100 | #337 | Tragic 19.1% |
| Lumbee | 0.0 /100 | #338 | Tragic 19.1% |
| Puerto Ricans | 0.0 /100 | #339 | Tragic 19.2% |
| Cape Verdeans | 0.0 /100 | #340 | Tragic 19.2% |
| Tohono O'odham | 0.0 /100 | #341 | Tragic 19.3% |
| Houma | 0.0 /100 | #342 | Tragic 19.3% |
| Immigrants | Zaire | 0.0 /100 | #343 | Tragic 19.4% |
| Immigrants | Congo | 0.0 /100 | #344 | Tragic 19.7% |
| Somalis | 0.0 /100 | #345 | Tragic 19.8% |
| Immigrants | Cabo Verde | 0.0 /100 | #346 | Tragic 19.9% |
| Immigrants | Somalia | 0.0 /100 | #347 | Tragic 20.0% |