Croatian vs Immigrants from Cabo Verde Cognitive Disability
COMPARE
Croatian
Immigrants from Cabo Verde
Cognitive Disability
Cognitive Disability Comparison
Croatians
Immigrants from Cabo Verde
16.4%
COGNITIVE DISABILITY
99.9/ 100
METRIC RATING
23rd/ 347
METRIC RANK
19.9%
COGNITIVE DISABILITY
0.0/ 100
METRIC RATING
346th/ 347
METRIC RANK
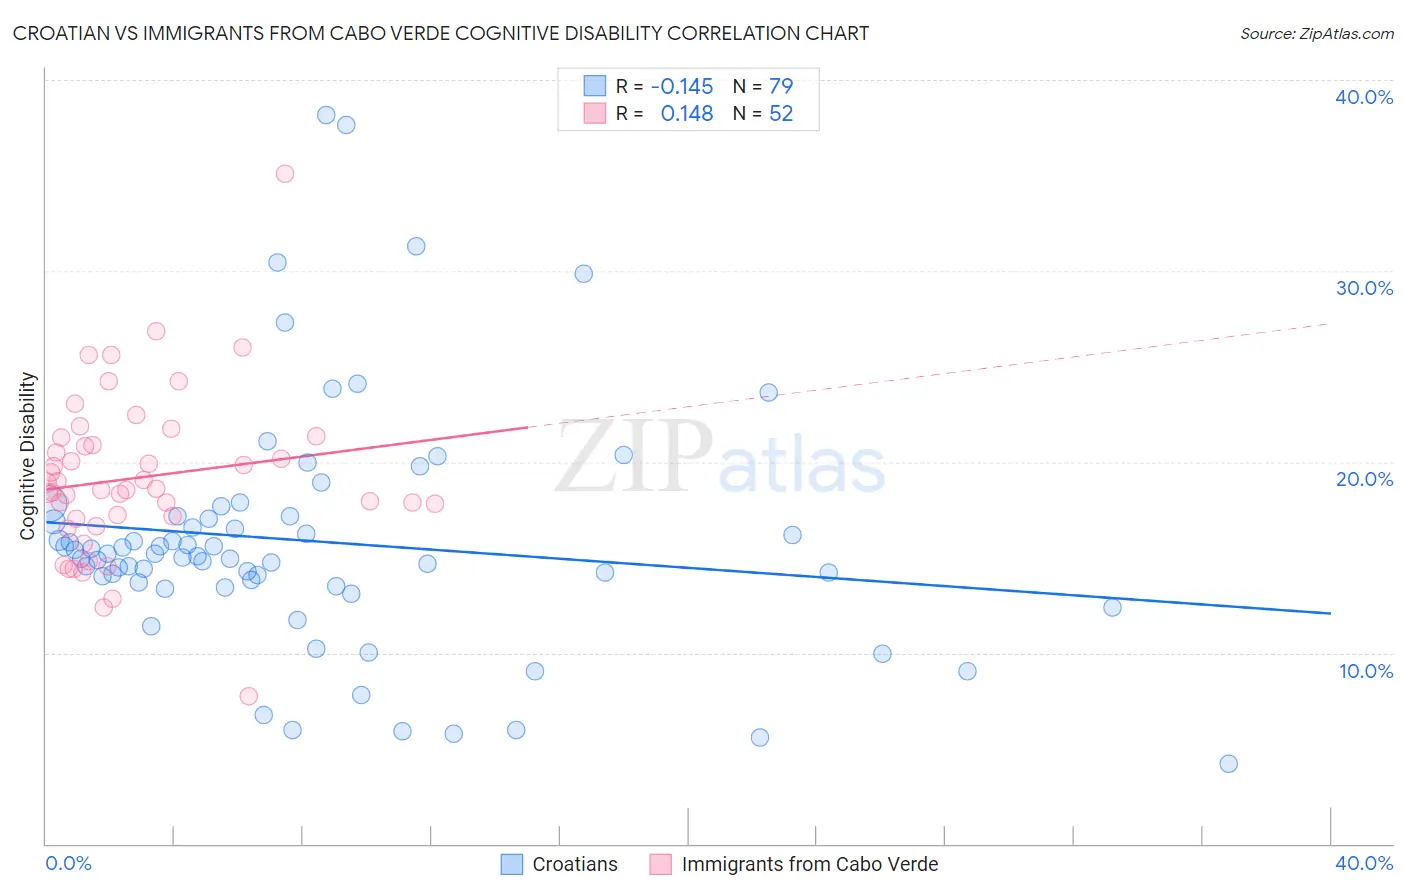
Croatian vs Immigrants from Cabo Verde Cognitive Disability Correlation Chart
The statistical analysis conducted on geographies consisting of 375,711,663 people shows a poor negative correlation between the proportion of Croatians and percentage of population with cognitive disability in the United States with a correlation coefficient (R) of -0.145 and weighted average of 16.4%. Similarly, the statistical analysis conducted on geographies consisting of 38,139,711 people shows a poor positive correlation between the proportion of Immigrants from Cabo Verde and percentage of population with cognitive disability in the United States with a correlation coefficient (R) of 0.148 and weighted average of 19.9%, a difference of 21.3%.
Cognitive Disability Correlation Summary
| Measurement | Croatian | Immigrants from Cabo Verde |
| Minimum | 4.2% | 7.7% |
| Maximum | 38.2% | 35.1% |
| Range | 34.0% | 27.4% |
| Mean | 15.8% | 19.2% |
| Median | 15.1% | 18.6% |
| Interquartile 25% (IQ1) | 13.5% | 17.1% |
| Interquartile 75% (IQ3) | 17.1% | 21.1% |
| Interquartile Range (IQR) | 3.6% | 4.0% |
| Standard Deviation (Sample) | 6.4% | 4.3% |
| Standard Deviation (Population) | 6.3% | 4.3% |
Similar Demographics by Cognitive Disability
Demographics Similar to Croatians by Cognitive Disability
In terms of cognitive disability, the demographic groups most similar to Croatians are Immigrants from South Central Asia (16.4%, a difference of 0.030%), Immigrants from Argentina (16.4%, a difference of 0.030%), Luxembourger (16.4%, a difference of 0.060%), Immigrants from Croatia (16.4%, a difference of 0.10%), and Immigrants from Pakistan (16.4%, a difference of 0.12%).
| Demographics | Rating | Rank | Cognitive Disability |
| Eastern Europeans | 100.0 /100 | #16 | Exceptional 16.3% |
| Immigrants | North Macedonia | 100.0 /100 | #17 | Exceptional 16.3% |
| Immigrants | Northern Europe | 100.0 /100 | #18 | Exceptional 16.3% |
| Immigrants | Bolivia | 100.0 /100 | #19 | Exceptional 16.3% |
| Bulgarians | 100.0 /100 | #20 | Exceptional 16.3% |
| Immigrants | Cuba | 100.0 /100 | #21 | Exceptional 16.3% |
| Immigrants | South Central Asia | 99.9 /100 | #22 | Exceptional 16.4% |
| Croatians | 99.9 /100 | #23 | Exceptional 16.4% |
| Immigrants | Argentina | 99.9 /100 | #24 | Exceptional 16.4% |
| Luxembourgers | 99.9 /100 | #25 | Exceptional 16.4% |
| Immigrants | Croatia | 99.9 /100 | #26 | Exceptional 16.4% |
| Immigrants | Pakistan | 99.9 /100 | #27 | Exceptional 16.4% |
| Poles | 99.9 /100 | #28 | Exceptional 16.4% |
| Filipinos | 99.9 /100 | #29 | Exceptional 16.4% |
| Czechs | 99.9 /100 | #30 | Exceptional 16.4% |
Demographics Similar to Immigrants from Cabo Verde by Cognitive Disability
In terms of cognitive disability, the demographic groups most similar to Immigrants from Cabo Verde are Somali (19.8%, a difference of 0.16%), Immigrants from Congo (19.7%, a difference of 0.72%), Immigrants from Somalia (20.0%, a difference of 0.73%), Immigrants from Zaire (19.4%, a difference of 2.4%), and Tohono O'odham (19.3%, a difference of 3.1%).
| Demographics | Rating | Rank | Cognitive Disability |
| Immigrants | Yemen | 0.0 /100 | #333 | Tragic 18.8% |
| Sudanese | 0.0 /100 | #334 | Tragic 18.9% |
| Senegalese | 0.0 /100 | #335 | Tragic 19.0% |
| Blacks/African Americans | 0.0 /100 | #336 | Tragic 19.0% |
| Immigrants | Saudi Arabia | 0.0 /100 | #337 | Tragic 19.1% |
| Lumbee | 0.0 /100 | #338 | Tragic 19.1% |
| Puerto Ricans | 0.0 /100 | #339 | Tragic 19.2% |
| Cape Verdeans | 0.0 /100 | #340 | Tragic 19.2% |
| Tohono O'odham | 0.0 /100 | #341 | Tragic 19.3% |
| Houma | 0.0 /100 | #342 | Tragic 19.3% |
| Immigrants | Zaire | 0.0 /100 | #343 | Tragic 19.4% |
| Immigrants | Congo | 0.0 /100 | #344 | Tragic 19.7% |
| Somalis | 0.0 /100 | #345 | Tragic 19.8% |
| Immigrants | Cabo Verde | 0.0 /100 | #346 | Tragic 19.9% |
| Immigrants | Somalia | 0.0 /100 | #347 | Tragic 20.0% |