Chilean vs Finnish Male Disability
COMPARE
Chilean
Finnish
Male Disability
Male Disability Comparison
Chileans
Finns
10.7%
MALE DISABILITY
96.9/ 100
METRIC RATING
95th/ 347
METRIC RANK
12.6%
MALE DISABILITY
0.0/ 100
METRIC RATING
277th/ 347
METRIC RANK
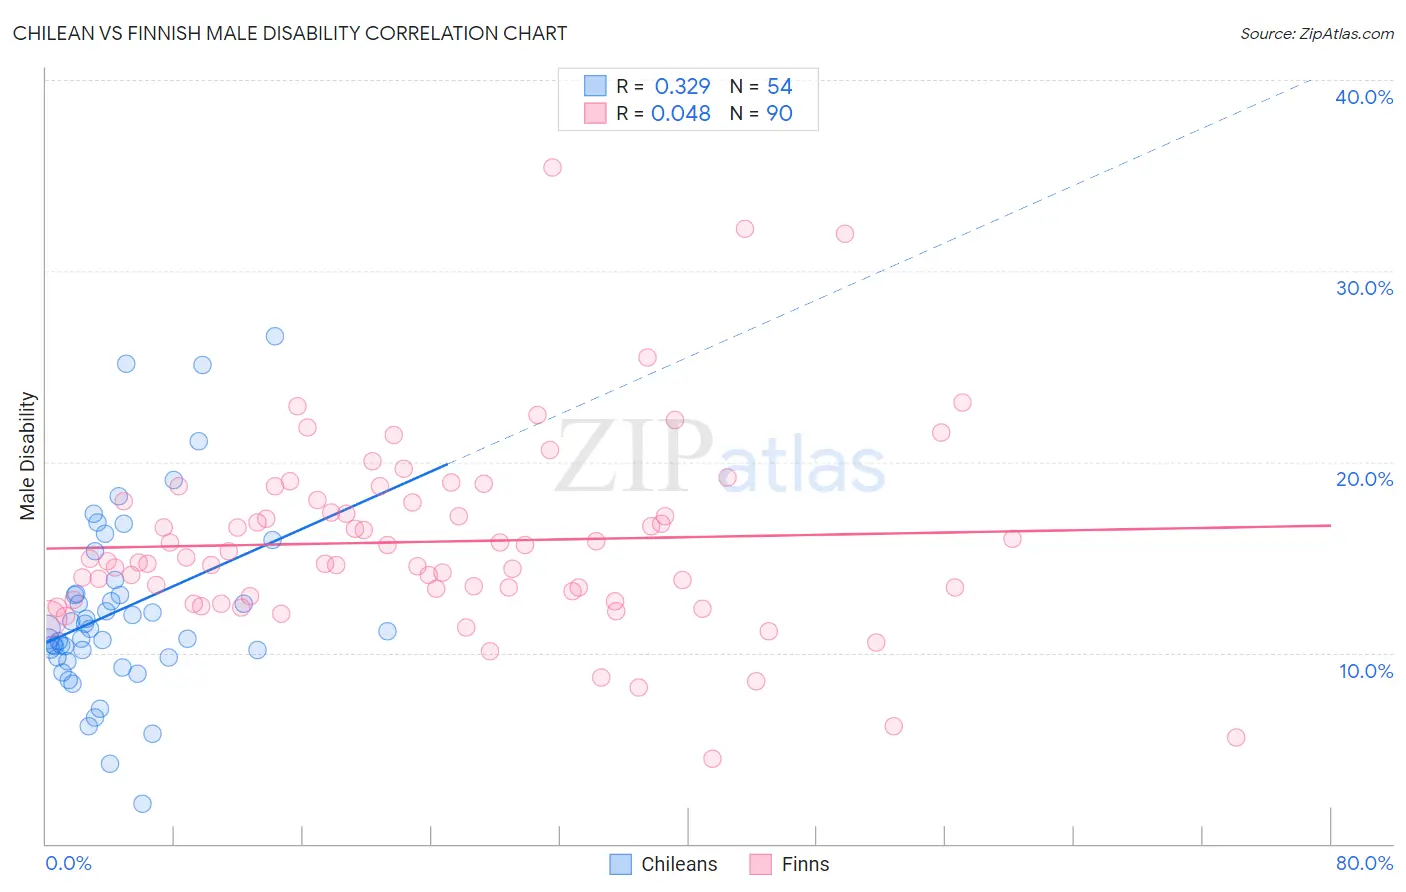
Chilean vs Finnish Male Disability Correlation Chart
The statistical analysis conducted on geographies consisting of 256,663,212 people shows a mild positive correlation between the proportion of Chileans and percentage of males with a disability in the United States with a correlation coefficient (R) of 0.329 and weighted average of 10.7%. Similarly, the statistical analysis conducted on geographies consisting of 404,606,067 people shows no correlation between the proportion of Finns and percentage of males with a disability in the United States with a correlation coefficient (R) of 0.048 and weighted average of 12.6%, a difference of 18.0%.
Male Disability Correlation Summary
| Measurement | Chilean | Finnish |
| Minimum | 2.1% | 4.5% |
| Maximum | 26.6% | 35.4% |
| Range | 24.5% | 30.9% |
| Mean | 12.2% | 15.8% |
| Median | 11.2% | 14.9% |
| Interquartile 25% (IQ1) | 9.8% | 12.9% |
| Interquartile 75% (IQ3) | 13.1% | 18.0% |
| Interquartile Range (IQR) | 3.3% | 5.0% |
| Standard Deviation (Sample) | 4.8% | 5.0% |
| Standard Deviation (Population) | 4.8% | 5.0% |
Similar Demographics by Male Disability
Demographics Similar to Chileans by Male Disability
In terms of male disability, the demographic groups most similar to Chileans are Immigrants from Sweden (10.7%, a difference of 0.030%), Nicaraguan (10.7%, a difference of 0.10%), Immigrants from Armenia (10.7%, a difference of 0.12%), Immigrants from St. Vincent and the Grenadines (10.7%, a difference of 0.14%), and Immigrants from Romania (10.7%, a difference of 0.18%).
| Demographics | Rating | Rank | Male Disability |
| Immigrants | Western Asia | 97.8 /100 | #88 | Exceptional 10.6% |
| Immigrants | Nicaragua | 97.8 /100 | #89 | Exceptional 10.6% |
| Immigrants | Morocco | 97.7 /100 | #90 | Exceptional 10.6% |
| Immigrants | France | 97.6 /100 | #91 | Exceptional 10.6% |
| Palestinians | 97.4 /100 | #92 | Exceptional 10.7% |
| Immigrants | St. Vincent and the Grenadines | 97.1 /100 | #93 | Exceptional 10.7% |
| Immigrants | Sweden | 96.9 /100 | #94 | Exceptional 10.7% |
| Chileans | 96.9 /100 | #95 | Exceptional 10.7% |
| Nicaraguans | 96.6 /100 | #96 | Exceptional 10.7% |
| Immigrants | Armenia | 96.6 /100 | #97 | Exceptional 10.7% |
| Immigrants | Romania | 96.5 /100 | #98 | Exceptional 10.7% |
| Immigrants | Switzerland | 96.1 /100 | #99 | Exceptional 10.7% |
| Immigrants | Kazakhstan | 95.9 /100 | #100 | Exceptional 10.7% |
| Immigrants | Greece | 95.6 /100 | #101 | Exceptional 10.7% |
| Immigrants | Eastern Europe | 95.3 /100 | #102 | Exceptional 10.7% |
Demographics Similar to Finns by Male Disability
In terms of male disability, the demographic groups most similar to Finns are African (12.6%, a difference of 0.31%), Fijian (12.6%, a difference of 0.37%), Central American Indian (12.7%, a difference of 0.50%), Slovak (12.7%, a difference of 0.65%), and Dutch (12.7%, a difference of 0.70%).
| Demographics | Rating | Rank | Male Disability |
| Spaniards | 0.1 /100 | #270 | Tragic 12.3% |
| Scandinavians | 0.1 /100 | #271 | Tragic 12.3% |
| Hmong | 0.0 /100 | #272 | Tragic 12.5% |
| Native Hawaiians | 0.0 /100 | #273 | Tragic 12.5% |
| Hopi | 0.0 /100 | #274 | Tragic 12.5% |
| Fijians | 0.0 /100 | #275 | Tragic 12.6% |
| Africans | 0.0 /100 | #276 | Tragic 12.6% |
| Finns | 0.0 /100 | #277 | Tragic 12.6% |
| Central American Indians | 0.0 /100 | #278 | Tragic 12.7% |
| Slovaks | 0.0 /100 | #279 | Tragic 12.7% |
| Dutch | 0.0 /100 | #280 | Tragic 12.7% |
| Sioux | 0.0 /100 | #281 | Tragic 12.7% |
| Irish | 0.0 /100 | #282 | Tragic 12.7% |
| Germans | 0.0 /100 | #283 | Tragic 12.7% |
| Spanish | 0.0 /100 | #284 | Tragic 12.7% |