Chinese vs Finnish Male Disability
COMPARE
Chinese
Finnish
Male Disability
Male Disability Comparison
Chinese
Finns
12.1%
MALE DISABILITY
0.4/ 100
METRIC RATING
255th/ 347
METRIC RANK
12.6%
MALE DISABILITY
0.0/ 100
METRIC RATING
277th/ 347
METRIC RANK
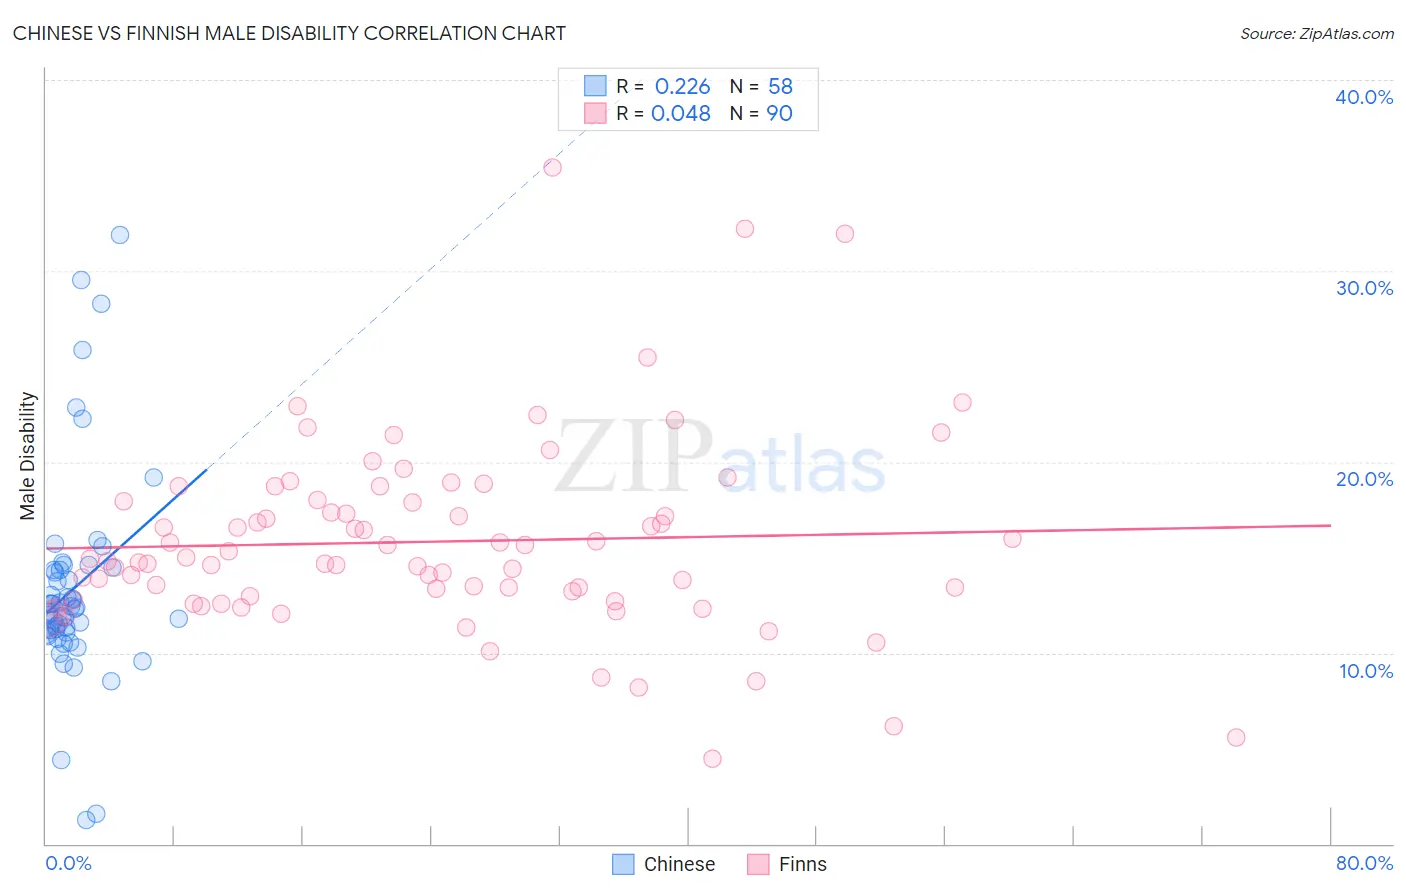
Chinese vs Finnish Male Disability Correlation Chart
The statistical analysis conducted on geographies consisting of 64,802,721 people shows a weak positive correlation between the proportion of Chinese and percentage of males with a disability in the United States with a correlation coefficient (R) of 0.226 and weighted average of 12.1%. Similarly, the statistical analysis conducted on geographies consisting of 404,606,067 people shows no correlation between the proportion of Finns and percentage of males with a disability in the United States with a correlation coefficient (R) of 0.048 and weighted average of 12.6%, a difference of 4.5%.
Male Disability Correlation Summary
| Measurement | Chinese | Finnish |
| Minimum | 1.3% | 4.5% |
| Maximum | 31.9% | 35.4% |
| Range | 30.7% | 30.9% |
| Mean | 13.4% | 15.8% |
| Median | 12.4% | 14.9% |
| Interquartile 25% (IQ1) | 11.1% | 12.9% |
| Interquartile 75% (IQ3) | 14.4% | 18.0% |
| Interquartile Range (IQR) | 3.3% | 5.0% |
| Standard Deviation (Sample) | 5.6% | 5.0% |
| Standard Deviation (Population) | 5.5% | 5.0% |
Similar Demographics by Male Disability
Demographics Similar to Chinese by Male Disability
In terms of male disability, the demographic groups most similar to Chinese are British (12.1%, a difference of 0.010%), Slovene (12.0%, a difference of 0.20%), Guamanian/Chamorro (12.0%, a difference of 0.20%), Swiss (12.1%, a difference of 0.25%), and European (12.1%, a difference of 0.25%).
| Demographics | Rating | Rank | Male Disability |
| Poles | 0.7 /100 | #248 | Tragic 12.0% |
| Immigrants | Yemen | 0.5 /100 | #249 | Tragic 12.0% |
| Bangladeshis | 0.5 /100 | #250 | Tragic 12.0% |
| German Russians | 0.5 /100 | #251 | Tragic 12.0% |
| Slovenes | 0.5 /100 | #252 | Tragic 12.0% |
| Guamanians/Chamorros | 0.5 /100 | #253 | Tragic 12.0% |
| British | 0.4 /100 | #254 | Tragic 12.1% |
| Chinese | 0.4 /100 | #255 | Tragic 12.1% |
| Swiss | 0.3 /100 | #256 | Tragic 12.1% |
| Europeans | 0.3 /100 | #257 | Tragic 12.1% |
| Basques | 0.3 /100 | #258 | Tragic 12.1% |
| Belgians | 0.3 /100 | #259 | Tragic 12.1% |
| Swedes | 0.3 /100 | #260 | Tragic 12.1% |
| Slavs | 0.2 /100 | #261 | Tragic 12.2% |
| Norwegians | 0.2 /100 | #262 | Tragic 12.2% |
Demographics Similar to Finns by Male Disability
In terms of male disability, the demographic groups most similar to Finns are African (12.6%, a difference of 0.31%), Fijian (12.6%, a difference of 0.37%), Central American Indian (12.7%, a difference of 0.50%), Slovak (12.7%, a difference of 0.65%), and Dutch (12.7%, a difference of 0.70%).
| Demographics | Rating | Rank | Male Disability |
| Spaniards | 0.1 /100 | #270 | Tragic 12.3% |
| Scandinavians | 0.1 /100 | #271 | Tragic 12.3% |
| Hmong | 0.0 /100 | #272 | Tragic 12.5% |
| Native Hawaiians | 0.0 /100 | #273 | Tragic 12.5% |
| Hopi | 0.0 /100 | #274 | Tragic 12.5% |
| Fijians | 0.0 /100 | #275 | Tragic 12.6% |
| Africans | 0.0 /100 | #276 | Tragic 12.6% |
| Finns | 0.0 /100 | #277 | Tragic 12.6% |
| Central American Indians | 0.0 /100 | #278 | Tragic 12.7% |
| Slovaks | 0.0 /100 | #279 | Tragic 12.7% |
| Dutch | 0.0 /100 | #280 | Tragic 12.7% |
| Sioux | 0.0 /100 | #281 | Tragic 12.7% |
| Irish | 0.0 /100 | #282 | Tragic 12.7% |
| Germans | 0.0 /100 | #283 | Tragic 12.7% |
| Spanish | 0.0 /100 | #284 | Tragic 12.7% |