Chickasaw vs Slovak Disability Age 65 to 74
COMPARE
Chickasaw
Slovak
Disability Age 65 to 74
Disability Age 65 to 74 Comparison
Chickasaw
Slovaks
30.2%
DISABILITY AGE 65 TO 74
0.0/ 100
METRIC RATING
331st/ 347
METRIC RANK
22.5%
DISABILITY AGE 65 TO 74
91.6/ 100
METRIC RATING
127th/ 347
METRIC RANK
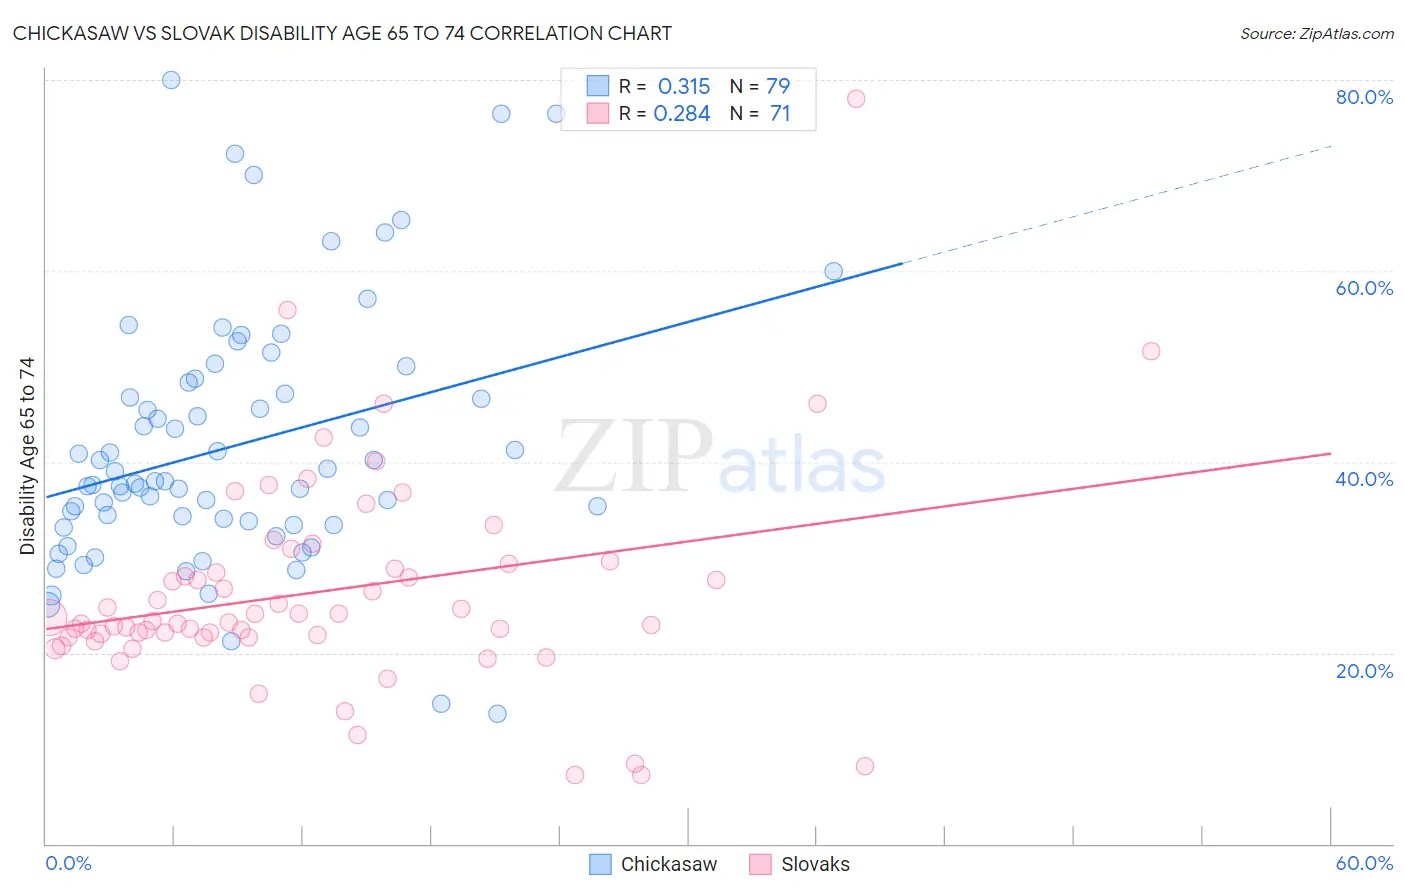
Chickasaw vs Slovak Disability Age 65 to 74 Correlation Chart
The statistical analysis conducted on geographies consisting of 147,556,011 people shows a mild positive correlation between the proportion of Chickasaw and percentage of population with a disability between the ages 65 and 75 in the United States with a correlation coefficient (R) of 0.315 and weighted average of 30.2%. Similarly, the statistical analysis conducted on geographies consisting of 397,207,671 people shows a weak positive correlation between the proportion of Slovaks and percentage of population with a disability between the ages 65 and 75 in the United States with a correlation coefficient (R) of 0.284 and weighted average of 22.5%, a difference of 34.1%.
Disability Age 65 to 74 Correlation Summary
| Measurement | Chickasaw | Slovak |
| Minimum | 13.6% | 7.1% |
| Maximum | 80.0% | 78.0% |
| Range | 66.4% | 70.9% |
| Mean | 41.7% | 26.4% |
| Median | 38.0% | 23.2% |
| Interquartile 25% (IQ1) | 33.3% | 21.6% |
| Interquartile 75% (IQ3) | 48.3% | 29.3% |
| Interquartile Range (IQR) | 14.9% | 7.7% |
| Standard Deviation (Sample) | 13.4% | 11.2% |
| Standard Deviation (Population) | 13.3% | 11.1% |
Similar Demographics by Disability Age 65 to 74
Demographics Similar to Chickasaw by Disability Age 65 to 74
In terms of disability age 65 to 74, the demographic groups most similar to Chickasaw are Creek (30.2%, a difference of 0.010%), Choctaw (30.2%, a difference of 0.040%), Native/Alaskan (30.4%, a difference of 0.62%), Hopi (30.0%, a difference of 0.84%), and Colville (30.5%, a difference of 1.1%).
| Demographics | Rating | Rank | Disability Age 65 to 74 |
| Seminole | 0.0 /100 | #324 | Tragic 29.4% |
| Dutch West Indians | 0.0 /100 | #325 | Tragic 29.6% |
| Yakama | 0.0 /100 | #326 | Tragic 29.6% |
| Apache | 0.0 /100 | #327 | Tragic 29.7% |
| Hopi | 0.0 /100 | #328 | Tragic 30.0% |
| Choctaw | 0.0 /100 | #329 | Tragic 30.2% |
| Creek | 0.0 /100 | #330 | Tragic 30.2% |
| Chickasaw | 0.0 /100 | #331 | Tragic 30.2% |
| Natives/Alaskans | 0.0 /100 | #332 | Tragic 30.4% |
| Colville | 0.0 /100 | #333 | Tragic 30.5% |
| Alaska Natives | 0.0 /100 | #334 | Tragic 30.6% |
| Cheyenne | 0.0 /100 | #335 | Tragic 31.1% |
| Yuman | 0.0 /100 | #336 | Tragic 31.5% |
| Houma | 0.0 /100 | #337 | Tragic 32.3% |
| Alaskan Athabascans | 0.0 /100 | #338 | Tragic 32.4% |
Demographics Similar to Slovaks by Disability Age 65 to 74
In terms of disability age 65 to 74, the demographic groups most similar to Slovaks are Lebanese (22.5%, a difference of 0.11%), Immigrants from Western Europe (22.5%, a difference of 0.13%), Norwegian (22.5%, a difference of 0.17%), Immigrants from Costa Rica (22.6%, a difference of 0.23%), and Immigrants from Uruguay (22.6%, a difference of 0.29%).
| Demographics | Rating | Rank | Disability Age 65 to 74 |
| Immigrants | Kazakhstan | 93.9 /100 | #120 | Exceptional 22.4% |
| Czechs | 93.5 /100 | #121 | Exceptional 22.4% |
| Immigrants | Jordan | 93.5 /100 | #122 | Exceptional 22.4% |
| Hungarians | 93.3 /100 | #123 | Exceptional 22.4% |
| Norwegians | 92.5 /100 | #124 | Exceptional 22.5% |
| Immigrants | Western Europe | 92.3 /100 | #125 | Exceptional 22.5% |
| Lebanese | 92.2 /100 | #126 | Exceptional 22.5% |
| Slovaks | 91.6 /100 | #127 | Exceptional 22.5% |
| Immigrants | Costa Rica | 90.4 /100 | #128 | Exceptional 22.6% |
| Immigrants | Uruguay | 90.1 /100 | #129 | Exceptional 22.6% |
| Immigrants | Albania | 90.0 /100 | #130 | Excellent 22.6% |
| Immigrants | Nepal | 89.4 /100 | #131 | Excellent 22.6% |
| Costa Ricans | 89.2 /100 | #132 | Excellent 22.6% |
| Northern Europeans | 88.9 /100 | #133 | Excellent 22.6% |
| Afghans | 88.6 /100 | #134 | Excellent 22.6% |