Immigrants from Somalia vs Immigrants from Trinidad and Tobago Disability Age 65 to 74

COMPARE

Immigrants from Somalia
Race
Ancestry
AfghanAfricanAlaska NativeAlaskan AthabascanAlbanianAleutAlsatianAmericanApacheArabArapahoArgentineanArmenianAssyrian/Chaldean/SyriacAustralianAustrianBahamianBangladeshiBarbadianBasqueBelgianBelizeanBermudanBhutaneseBlackfeetBolivianBrazilianBritishBritish West IndianBulgarianBurmeseCajunCambodianCanadianCape VerdeanCarpatho RusynCelticCentral AmericanCentral American IndianCherokeeCheyenneChickasawChileanChineseChippewaChoctawColombianColvilleComancheCosta RicanCreeCreekCroatianCrowCubanCypriotCzechCzechoslovakianDanishDelawareDominicanDutchDutch West IndianEastern EuropeanEcuadorianEgyptianEnglishEstonianEthiopianEuropeanFijianFilipinoFinnishFrenchFrench American IndianFrench CanadianGermanGerman RussianGhanaianGreekGuamanian/ChamorroGuatemalanGuyaneseHaitianHmongHonduranHopiHoumaHungarianIcelanderIndian (Asian)IndonesianInupiatIranianIraqiIrishIroquoisIsraeliItalianJamaicanJapaneseJordanianKenyanKiowaKoreanLaotianLatvianLebaneseLiberianLithuanianLumbeeLuxembourgerMacedonianMalaysianMalteseMarshalleseMenomineeMexicanMexican American IndianMongolianMoroccanNative HawaiianNavajoNepaleseNew ZealanderNicaraguanNigerianNorthern EuropeanNorwegianOkinawanOsageOttawaPaiutePakistaniPalestinianPanamanianParaguayanPennsylvania GermanPeruvianPimaPolishPortuguesePotawatomiPuebloPuerto RicanPuget Sound SalishRomanianRussianSalvadoranSamoanScandinavianScotch-IrishScottishSeminoleSenegaleseSerbianShoshoneSierra LeoneanSiouxSlavicSlovakSloveneSomaliSouth AfricanSouth AmericanSouth American IndianSoviet UnionSpaniardSpanishSpanish AmericanSpanish American IndianSri LankanSubsaharan AfricanSudaneseSwedishSwissSyrianTaiwaneseThaiTlingit-HaidaTohono O'OdhamTonganTrinidadian and TobagonianTsimshianTurkishU.S. Virgin IslanderUgandanUkrainianUruguayanUteVenezuelanVietnameseWelshWest IndianYakamaYaquiYugoslavianYumanYup'ikZimbabwean
Immigration
NonimmigrantsImmigrantsAfghanistanAfricaAlbaniaArgentinaArmeniaAsiaAustraliaAustriaBahamasBangladeshBarbadosBelarusBelgiumBelizeBoliviaBosnia and HerzegovinaBrazilBulgariaBurma/MyanmarCabo VerdeCambodiaCameroonCanadaCaribbeanCentral AmericaChileChinaColombiaCongoCosta RicaCroatiaCubaCzechoslovakiaDenmarkDominicaDominican RepublicEastern AfricaEastern AsiaEastern EuropeEcuadorEgyptEl SalvadorEnglandEritreaEthiopiaEuropeFijiFranceGermanyGhanaGreeceGrenadaGuatemalaGuyanaHaitiHondurasHong KongHungaryIndiaIndonesiaIranIraqIrelandIsraelItalyJamaicaJapanJordanKazakhstanKenyaKoreaKuwaitLaosLatin AmericaLatviaLebanonLiberiaLithuaniaMalaysiaMexicoMicronesiaMiddle AfricaMoldovaMoroccoNepalNetherlandsNicaraguaNigeriaNorth AmericaNorth MacedoniaNorthern AfricaNorthern EuropeNorwayOceaniaPakistanPanamaPeruPhilippinesPolandPortugalRomaniaRussiaSaudi ArabiaScotlandSenegalSerbiaSierra LeoneSingaporeSomaliaSouth AfricaSouth AmericaSouth Central AsiaSouth Eastern AsiaSouthern EuropeSpainSri LankaSt. Vincent and the GrenadinesSudanSwedenSwitzerlandSyriaTaiwanThailandTurkeyUgandaUkraineUruguayUzbekistanVenezuelaVietnamWest IndiesWestern AfricaWestern AsiaWestern EuropeYemenZaireZimbabweAzores
Immigrants from Trinidad and Tobago
Race
Ancestry
AfghanAfricanAlaska NativeAlaskan AthabascanAlbanianAleutAlsatianAmericanApacheArabArapahoArgentineanArmenianAssyrian/Chaldean/SyriacAustralianAustrianBahamianBangladeshiBarbadianBasqueBelgianBelizeanBermudanBhutaneseBlackfeetBolivianBrazilianBritishBritish West IndianBulgarianBurmeseCajunCambodianCanadianCape VerdeanCarpatho RusynCelticCentral AmericanCentral American IndianCherokeeCheyenneChickasawChileanChineseChippewaChoctawColombianColvilleComancheCosta RicanCreeCreekCroatianCrowCubanCypriotCzechCzechoslovakianDanishDelawareDominicanDutchDutch West IndianEastern EuropeanEcuadorianEgyptianEnglishEstonianEthiopianEuropeanFijianFilipinoFinnishFrenchFrench American IndianFrench CanadianGermanGerman RussianGhanaianGreekGuamanian/ChamorroGuatemalanGuyaneseHaitianHmongHonduranHopiHoumaHungarianIcelanderIndian (Asian)IndonesianInupiatIranianIraqiIrishIroquoisIsraeliItalianJamaicanJapaneseJordanianKenyanKiowaKoreanLaotianLatvianLebaneseLiberianLithuanianLumbeeLuxembourgerMacedonianMalaysianMalteseMarshalleseMenomineeMexicanMexican American IndianMongolianMoroccanNative HawaiianNavajoNepaleseNew ZealanderNicaraguanNigerianNorthern EuropeanNorwegianOkinawanOsageOttawaPaiutePakistaniPalestinianPanamanianParaguayanPennsylvania GermanPeruvianPimaPolishPortuguesePotawatomiPuebloPuerto RicanPuget Sound SalishRomanianRussianSalvadoranSamoanScandinavianScotch-IrishScottishSeminoleSenegaleseSerbianShoshoneSierra LeoneanSiouxSlavicSlovakSloveneSomaliSouth AfricanSouth AmericanSouth American IndianSoviet UnionSpaniardSpanishSpanish AmericanSpanish American IndianSri LankanSubsaharan AfricanSudaneseSwedishSwissSyrianTaiwaneseThaiTlingit-HaidaTohono O'OdhamTonganTrinidadian and TobagonianTsimshianTurkishU.S. Virgin IslanderUgandanUkrainianUruguayanUteVenezuelanVietnameseWelshWest IndianYakamaYaquiYugoslavianYumanYup'ikZimbabwean
Immigration
NonimmigrantsImmigrantsAfghanistanAfricaAlbaniaArgentinaArmeniaAsiaAustraliaAustriaBahamasBangladeshBarbadosBelarusBelgiumBelizeBoliviaBosnia and HerzegovinaBrazilBulgariaBurma/MyanmarCabo VerdeCambodiaCameroonCanadaCaribbeanCentral AmericaChileChinaColombiaCongoCosta RicaCroatiaCubaCzechoslovakiaDenmarkDominicaDominican RepublicEastern AfricaEastern AsiaEastern EuropeEcuadorEgyptEl SalvadorEnglandEritreaEthiopiaEuropeFijiFranceGermanyGhanaGreeceGrenadaGuatemalaGuyanaHaitiHondurasHong KongHungaryIndiaIndonesiaIranIraqIrelandIsraelItalyJamaicaJapanJordanKazakhstanKenyaKoreaKuwaitLaosLatin AmericaLatviaLebanonLiberiaLithuaniaMalaysiaMexicoMicronesiaMiddle AfricaMoldovaMoroccoNepalNetherlandsNicaraguaNigeriaNorth AmericaNorth MacedoniaNorthern AfricaNorthern EuropeNorwayOceaniaPakistanPanamaPeruPhilippinesPolandPortugalRomaniaRussiaSaudi ArabiaScotlandSenegalSerbiaSierra LeoneSingaporeSouth AfricaSouth AmericaSouth Central AsiaSouth Eastern AsiaSouthern EuropeSpainSri LankaSt. Vincent and the GrenadinesSudanSwedenSwitzerlandSyriaTaiwanThailandTrinidad and TobagoTurkeyUgandaUkraineUruguayUzbekistanVenezuelaVietnamWest IndiesWestern AfricaWestern AsiaWestern EuropeYemenZaireZimbabweAzores
Disability Age 65 to 74
Income
Poverty
Unemployment
Labor Participation
Family Structure
Vehicle Availability
Education Level
Disability

Disability Age 65 to 74 Comparison

Immigrants from Somalia

Immigrants from Trinidad and Tobago

Tragic
Fair
25.2%
DISABILITY AGE 65 TO 74
0.4/ 100
METRIC RATING
256th/ 347
METRIC RANK
23.7%
DISABILITY AGE 65 TO 74
26.1/ 100
METRIC RATING
196th/ 347
METRIC RANK

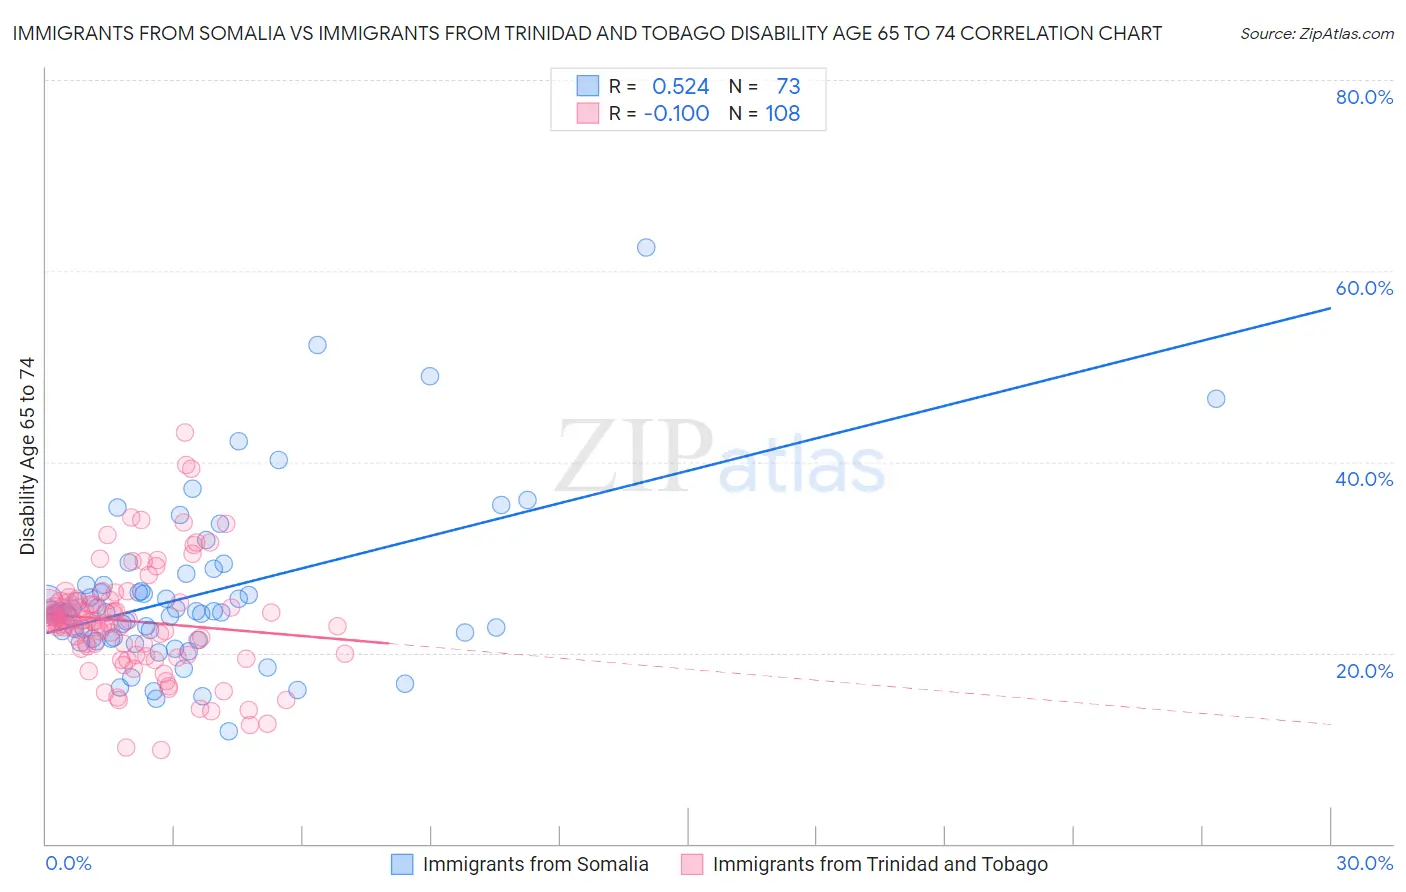
Immigrants from Somalia vs Immigrants from Trinidad and Tobago Disability Age 65 to 74 Correlation Chart

The statistical analysis conducted on geographies consisting of 92,082,399 people shows a substantial positive correlation between the proportion of Immigrants from Somalia and percentage of population with a disability between the ages 65 and 75 in the United States with a correlation coefficient (R) of 0.524 and weighted average of 25.2%. Similarly, the statistical analysis conducted on geographies consisting of 223,307,816 people shows a poor negative correlation between the proportion of Immigrants from Trinidad and Tobago and percentage of population with a disability between the ages 65 and 75 in the United States with a correlation coefficient (R) of -0.100 and weighted average of 23.7%, a difference of 6.5%.
Immigrants from Somalia vs Immigrants from Trinidad and Tobago Disability Age 65 to 74

Disability Age 65 to 74 Correlation Summary

MeasurementImmigrants from SomaliaImmigrants from Trinidad and Tobago
Minimum11.8%9.9%
Maximum62.5%43.1%
Range50.7%33.2%
Mean26.1%23.3%
Median24.3%23.3%
Interquartile 25% (IQ1)21.5%19.8%
Interquartile 75% (IQ3)27.0%25.3%
Interquartile Range (IQR)5.6%5.5%
Standard Deviation (Sample)8.7%5.8%
Standard Deviation (Population)8.6%5.8%

Similar Demographics by Disability Age 65 to 74

Demographics Similar to Immigrants from Somalia by Disability Age 65 to 74

In terms of disability age 65 to 74, the demographic groups most similar to Immigrants from Somalia are Guamanian/Chamorro (25.3%, a difference of 0.17%), Marshallese (25.3%, a difference of 0.23%), Immigrants from Cambodia (25.3%, a difference of 0.32%), Central American (25.1%, a difference of 0.41%), and Somali (25.1%, a difference of 0.57%).
DemographicsRating | RankDisability Age 65 to 74
Immigrants | Fiji
0.8
/100
|
#249
Tragic
25.0%
Salvadorans
0.8
/100
|
#250
Tragic
25.0%
Immigrants | Nonimmigrants
0.7
/100
|
#251
Tragic
25.0%
Immigrants | El Salvador
0.6
/100
|
#252
Tragic
25.1%
Sub-Saharan Africans
0.6
/100
|
#253
Tragic
25.1%
Somalis
0.6
/100
|
#254
Tragic
25.1%
Central Americans
0.5
/100
|
#255
Tragic
25.1%
Immigrants | Somalia
0.4
/100
|
#256
Tragic
25.2%
Guamanians/Chamorros
0.3
/100
|
#257
Tragic
25.3%
Marshallese
0.3
/100
|
#258
Tragic
25.3%
Immigrants | Cambodia
0.3
/100
|
#259
Tragic
25.3%
Malaysians
0.2
/100
|
#260
Tragic
25.4%
Cape Verdeans
0.2
/100
|
#261
Tragic
25.4%
Samoans
0.2
/100
|
#262
Tragic
25.4%
Iroquois
0.2
/100
|
#263
Tragic
25.4%

Demographics Similar to Immigrants from Trinidad and Tobago by Disability Age 65 to 74

In terms of disability age 65 to 74, the demographic groups most similar to Immigrants from Trinidad and Tobago are Immigrants from St. Vincent and the Grenadines (23.7%, a difference of 0.0%), Immigrants (23.7%, a difference of 0.020%), Sudanese (23.7%, a difference of 0.13%), Immigrants from Africa (23.7%, a difference of 0.13%), and Welsh (23.7%, a difference of 0.13%).
DemographicsRating | RankDisability Age 65 to 74
Scottish
33.1
/100
|
#189
Fair
23.6%
Immigrants | Guyana
31.2
/100
|
#190
Fair
23.6%
Immigrants | Bangladesh
30.2
/100
|
#191
Fair
23.6%
Ecuadorians
29.7
/100
|
#192
Fair
23.6%
English
28.5
/100
|
#193
Fair
23.6%
Sudanese
27.8
/100
|
#194
Fair
23.7%
Immigrants | St. Vincent and the Grenadines
26.1
/100
|
#195
Fair
23.7%
Immigrants | Trinidad and Tobago
26.1
/100
|
#196
Fair
23.7%
Immigrants | Immigrants
25.8
/100
|
#197
Fair
23.7%
Immigrants | Africa
24.4
/100
|
#198
Fair
23.7%
Welsh
24.3
/100
|
#199
Fair
23.7%
French Canadians
24.0
/100
|
#200
Fair
23.7%
Immigrants | Ecuador
23.9
/100
|
#201
Fair
23.7%
Immigrants | Bahamas
23.3
/100
|
#202
Fair
23.7%
Kenyans
23.2
/100
|
#203
Fair
23.7%