Chickasaw vs Immigrants from Micronesia Disability Age Over 75
COMPARE
Chickasaw
Immigrants from Micronesia
Disability Age Over 75
Disability Age Over 75 Comparison
Chickasaw
Immigrants from Micronesia
51.2%
DISABILITY AGE OVER 75
0.0/ 100
METRIC RATING
316th/ 347
METRIC RANK
50.1%
DISABILITY AGE OVER 75
0.0/ 100
METRIC RATING
299th/ 347
METRIC RANK
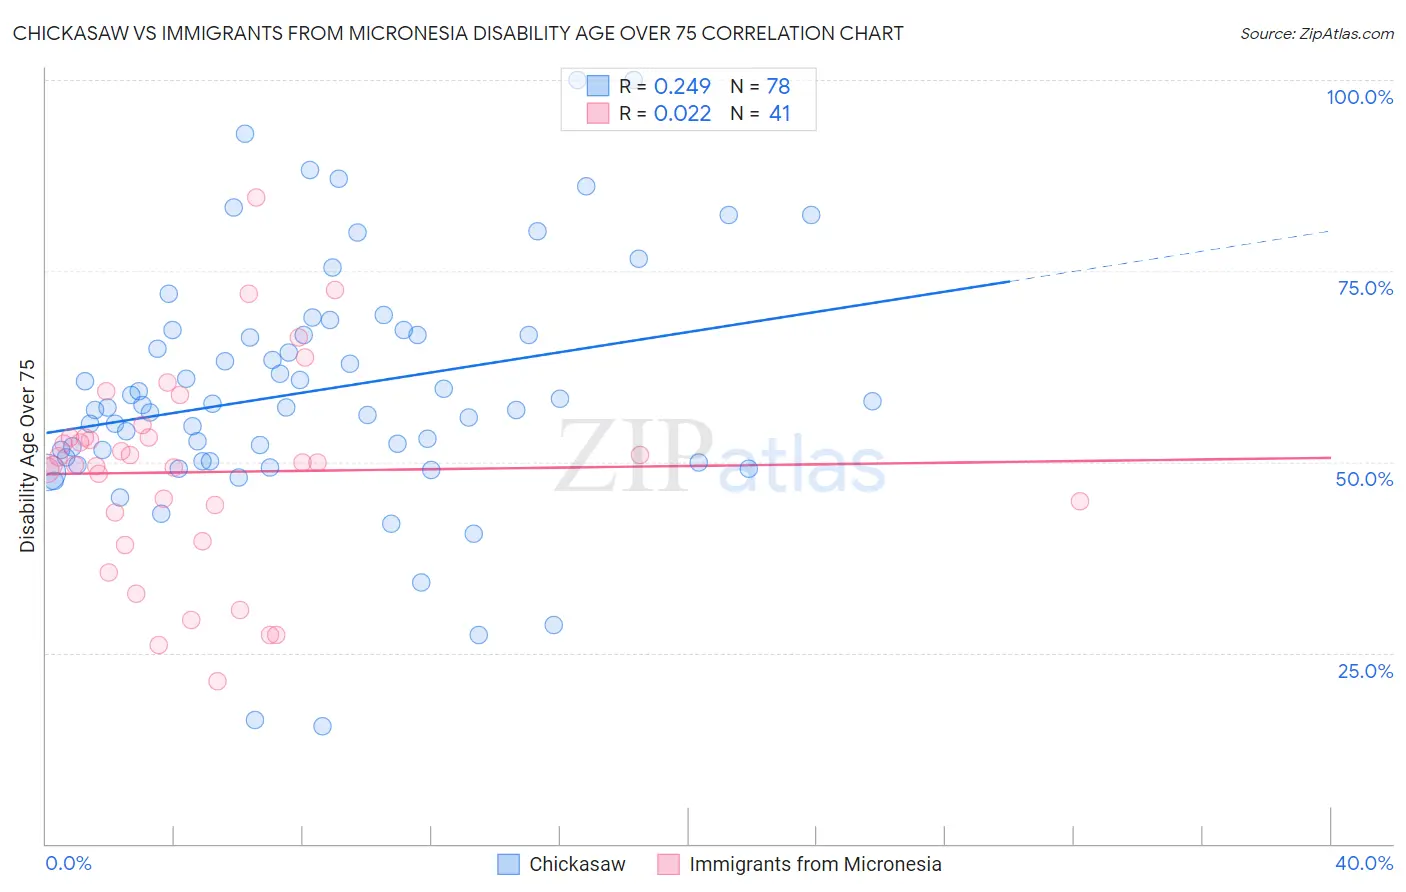
Chickasaw vs Immigrants from Micronesia Disability Age Over 75 Correlation Chart
The statistical analysis conducted on geographies consisting of 147,558,416 people shows a weak positive correlation between the proportion of Chickasaw and percentage of population with a disability over the age of 75 in the United States with a correlation coefficient (R) of 0.249 and weighted average of 51.2%. Similarly, the statistical analysis conducted on geographies consisting of 61,409,070 people shows no correlation between the proportion of Immigrants from Micronesia and percentage of population with a disability over the age of 75 in the United States with a correlation coefficient (R) of 0.022 and weighted average of 50.1%, a difference of 2.2%.
Disability Age Over 75 Correlation Summary
| Measurement | Chickasaw | Immigrants from Micronesia |
| Minimum | 15.4% | 21.2% |
| Maximum | 100.0% | 84.7% |
| Range | 84.6% | 63.5% |
| Mean | 59.3% | 48.7% |
| Median | 57.3% | 49.9% |
| Interquartile 25% (IQ1) | 50.1% | 41.5% |
| Interquartile 75% (IQ3) | 66.7% | 53.2% |
| Interquartile Range (IQR) | 16.6% | 11.7% |
| Standard Deviation (Sample) | 16.1% | 13.3% |
| Standard Deviation (Population) | 16.0% | 13.1% |
Demographics Similar to Chickasaw and Immigrants from Micronesia by Disability Age Over 75
In terms of disability age over 75, the demographic groups most similar to Chickasaw are Mexican (51.1%, a difference of 0.14%), Yakama (51.3%, a difference of 0.18%), Immigrants from Mexico (51.1%, a difference of 0.19%), Immigrants from the Azores (50.9%, a difference of 0.56%), and Cheyenne (50.9%, a difference of 0.61%). Similarly, the demographic groups most similar to Immigrants from Micronesia are Cape Verdean (50.1%, a difference of 0.040%), Marshallese (50.1%, a difference of 0.070%), Dominican (50.2%, a difference of 0.090%), Armenian (50.0%, a difference of 0.12%), and Cherokee (50.2%, a difference of 0.25%).
| Demographics | Rating | Rank | Disability Age Over 75 |
| Armenians | 0.0 /100 | #297 | Tragic 50.0% |
| Marshallese | 0.0 /100 | #298 | Tragic 50.1% |
| Immigrants | Micronesia | 0.0 /100 | #299 | Tragic 50.1% |
| Cape Verdeans | 0.0 /100 | #300 | Tragic 50.1% |
| Dominicans | 0.0 /100 | #301 | Tragic 50.2% |
| Cherokee | 0.0 /100 | #302 | Tragic 50.2% |
| Japanese | 0.0 /100 | #303 | Tragic 50.2% |
| Immigrants | Dominican Republic | 0.0 /100 | #304 | Tragic 50.3% |
| Central American Indians | 0.0 /100 | #305 | Tragic 50.5% |
| Immigrants | Central America | 0.0 /100 | #306 | Tragic 50.5% |
| Immigrants | Fiji | 0.0 /100 | #307 | Tragic 50.6% |
| Hispanics or Latinos | 0.0 /100 | #308 | Tragic 50.6% |
| Aleuts | 0.0 /100 | #309 | Tragic 50.6% |
| Tlingit-Haida | 0.0 /100 | #310 | Tragic 50.6% |
| Cajuns | 0.0 /100 | #311 | Tragic 50.7% |
| Cheyenne | 0.0 /100 | #312 | Tragic 50.9% |
| Immigrants | Azores | 0.0 /100 | #313 | Tragic 50.9% |
| Immigrants | Mexico | 0.0 /100 | #314 | Tragic 51.1% |
| Mexicans | 0.0 /100 | #315 | Tragic 51.1% |
| Chickasaw | 0.0 /100 | #316 | Tragic 51.2% |
| Yakama | 0.0 /100 | #317 | Tragic 51.3% |