Chickasaw vs Dutch West Indian Disability Age Over 75
COMPARE
Chickasaw
Dutch West Indian
Disability Age Over 75
Disability Age Over 75 Comparison
Chickasaw
Dutch West Indians
51.2%
DISABILITY AGE OVER 75
0.0/ 100
METRIC RATING
316th/ 347
METRIC RANK
51.5%
DISABILITY AGE OVER 75
0.0/ 100
METRIC RATING
321st/ 347
METRIC RANK
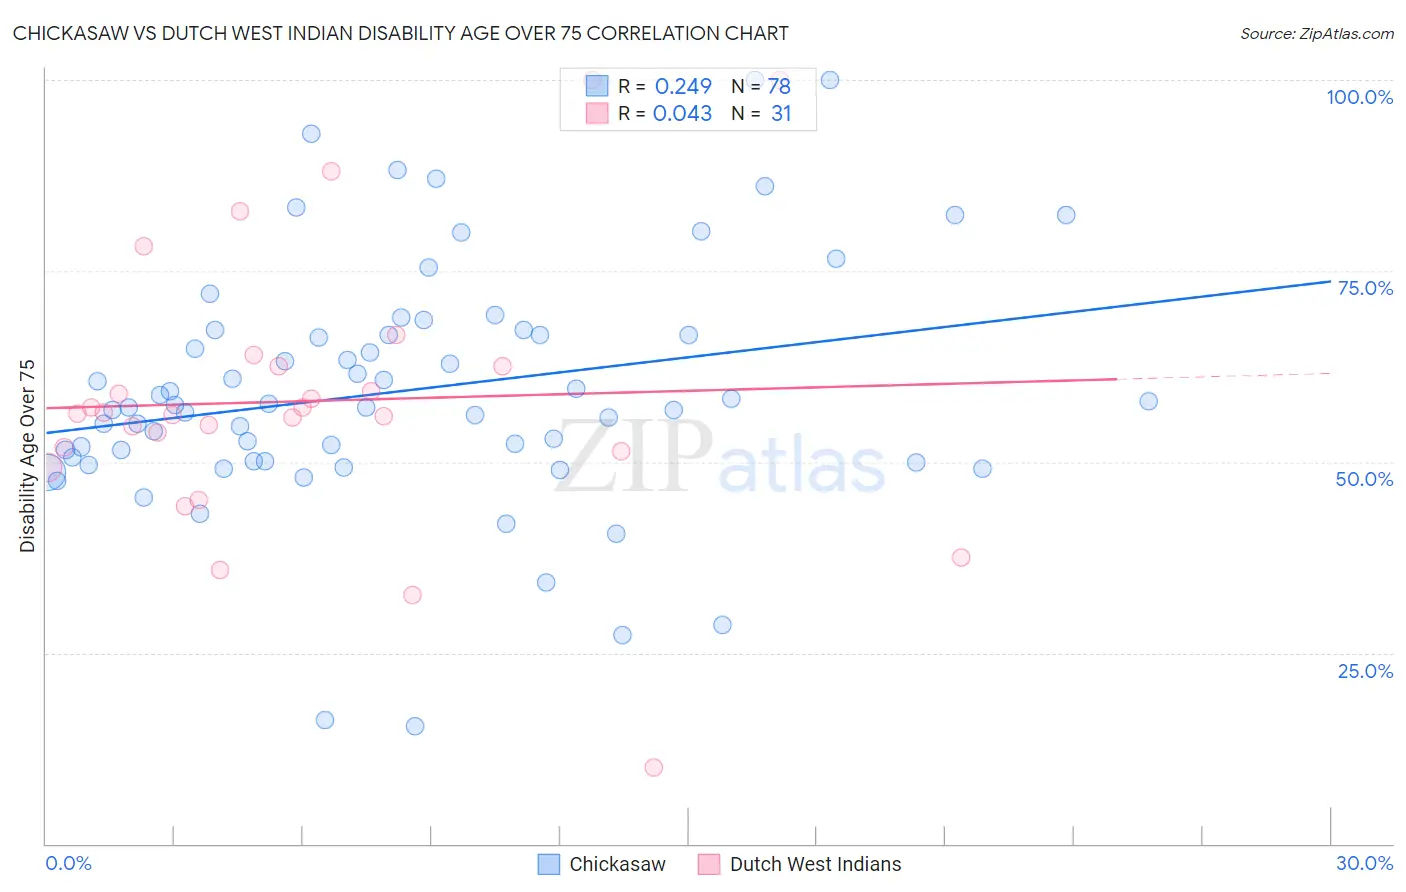
Chickasaw vs Dutch West Indian Disability Age Over 75 Correlation Chart
The statistical analysis conducted on geographies consisting of 147,558,416 people shows a weak positive correlation between the proportion of Chickasaw and percentage of population with a disability over the age of 75 in the United States with a correlation coefficient (R) of 0.249 and weighted average of 51.2%. Similarly, the statistical analysis conducted on geographies consisting of 85,737,433 people shows no correlation between the proportion of Dutch West Indians and percentage of population with a disability over the age of 75 in the United States with a correlation coefficient (R) of 0.043 and weighted average of 51.5%, a difference of 0.66%.
Disability Age Over 75 Correlation Summary
| Measurement | Chickasaw | Dutch West Indian |
| Minimum | 15.4% | 10.0% |
| Maximum | 100.0% | 100.0% |
| Range | 84.6% | 90.0% |
| Mean | 59.3% | 58.0% |
| Median | 57.3% | 56.4% |
| Interquartile 25% (IQ1) | 50.1% | 51.4% |
| Interquartile 75% (IQ3) | 66.7% | 62.5% |
| Interquartile Range (IQR) | 16.6% | 11.1% |
| Standard Deviation (Sample) | 16.1% | 18.3% |
| Standard Deviation (Population) | 16.0% | 18.0% |
Demographics Similar to Chickasaw and Dutch West Indians by Disability Age Over 75
In terms of disability age over 75, the demographic groups most similar to Chickasaw are Mexican (51.1%, a difference of 0.14%), Yakama (51.3%, a difference of 0.18%), Immigrants from Mexico (51.1%, a difference of 0.19%), Seminole (51.5%, a difference of 0.51%), and Creek (51.5%, a difference of 0.51%). Similarly, the demographic groups most similar to Dutch West Indians are Paiute (51.5%, a difference of 0.0%), Seminole (51.5%, a difference of 0.15%), Creek (51.5%, a difference of 0.15%), Comanche (51.7%, a difference of 0.34%), and Yakama (51.3%, a difference of 0.48%).
| Demographics | Rating | Rank | Disability Age Over 75 |
| Hispanics or Latinos | 0.0 /100 | #308 | Tragic 50.6% |
| Aleuts | 0.0 /100 | #309 | Tragic 50.6% |
| Tlingit-Haida | 0.0 /100 | #310 | Tragic 50.6% |
| Cajuns | 0.0 /100 | #311 | Tragic 50.7% |
| Cheyenne | 0.0 /100 | #312 | Tragic 50.9% |
| Immigrants | Azores | 0.0 /100 | #313 | Tragic 50.9% |
| Immigrants | Mexico | 0.0 /100 | #314 | Tragic 51.1% |
| Mexicans | 0.0 /100 | #315 | Tragic 51.1% |
| Chickasaw | 0.0 /100 | #316 | Tragic 51.2% |
| Yakama | 0.0 /100 | #317 | Tragic 51.3% |
| Seminole | 0.0 /100 | #318 | Tragic 51.5% |
| Creek | 0.0 /100 | #319 | Tragic 51.5% |
| Paiute | 0.0 /100 | #320 | Tragic 51.5% |
| Dutch West Indians | 0.0 /100 | #321 | Tragic 51.5% |
| Comanche | 0.0 /100 | #322 | Tragic 51.7% |
| Immigrants | Yemen | 0.0 /100 | #323 | Tragic 52.0% |
| Menominee | 0.0 /100 | #324 | Tragic 52.3% |
| Immigrants | Cabo Verde | 0.0 /100 | #325 | Tragic 52.4% |
| Ute | 0.0 /100 | #326 | Tragic 52.6% |
| Nepalese | 0.0 /100 | #327 | Tragic 52.6% |
| Choctaw | 0.0 /100 | #328 | Tragic 52.7% |