Immigrants from Greece vs Bahamian Ambulatory Disability
COMPARE
Immigrants from Greece
Bahamian
Ambulatory Disability
Ambulatory Disability Comparison
Immigrants from Greece
Bahamians
6.0%
AMBULATORY DISABILITY
82.5/ 100
METRIC RATING
146th/ 347
METRIC RANK
6.6%
AMBULATORY DISABILITY
0.2/ 100
METRIC RATING
265th/ 347
METRIC RANK
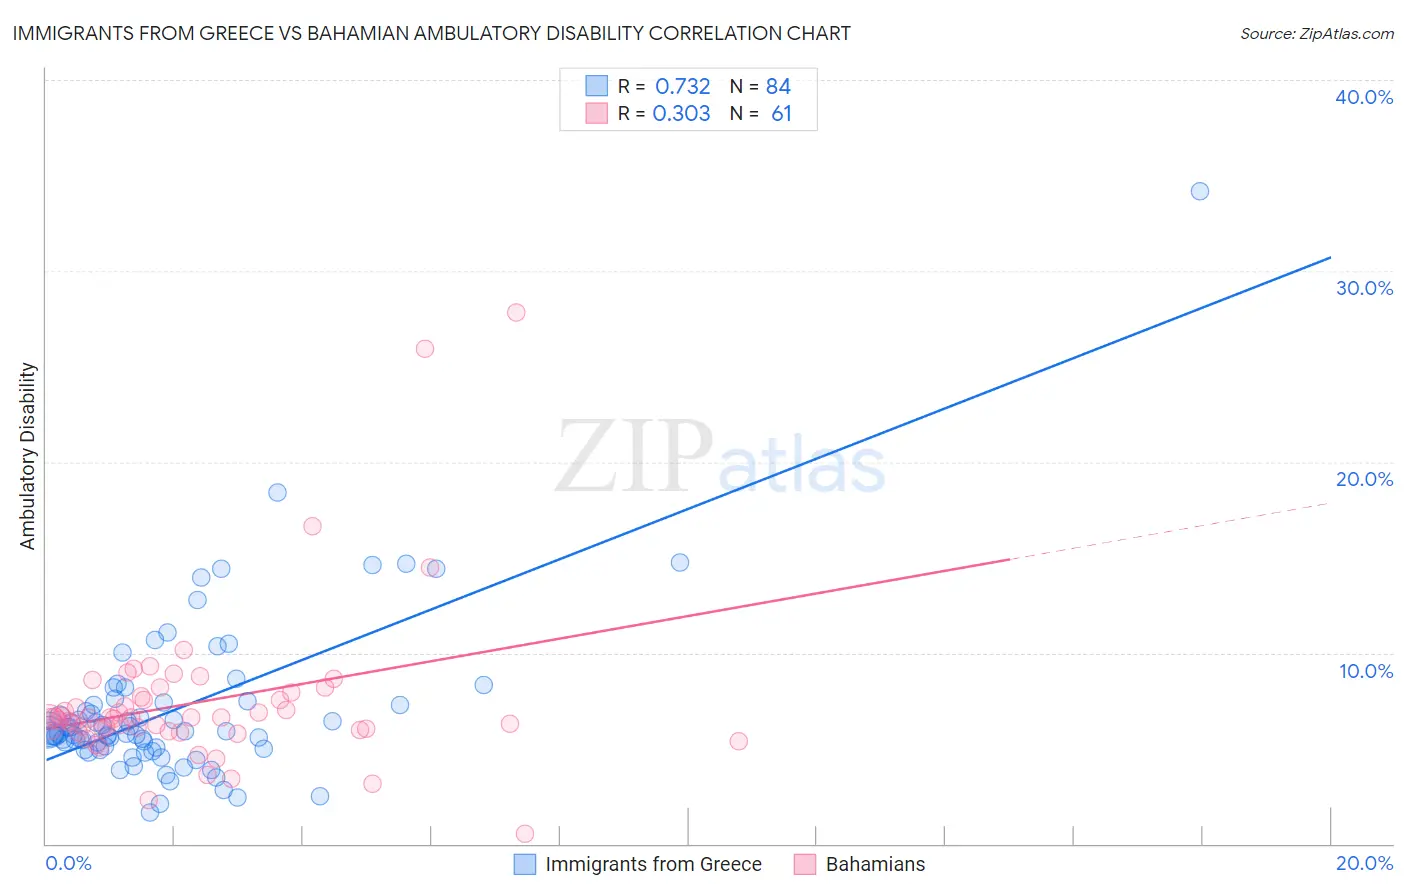
Immigrants from Greece vs Bahamian Ambulatory Disability Correlation Chart
The statistical analysis conducted on geographies consisting of 216,870,944 people shows a strong positive correlation between the proportion of Immigrants from Greece and percentage of population with ambulatory disability in the United States with a correlation coefficient (R) of 0.732 and weighted average of 6.0%. Similarly, the statistical analysis conducted on geographies consisting of 112,670,822 people shows a mild positive correlation between the proportion of Bahamians and percentage of population with ambulatory disability in the United States with a correlation coefficient (R) of 0.303 and weighted average of 6.6%, a difference of 10.3%.
Ambulatory Disability Correlation Summary
| Measurement | Immigrants from Greece | Bahamian |
| Minimum | 1.7% | 0.55% |
| Maximum | 34.2% | 27.8% |
| Range | 32.5% | 27.3% |
| Mean | 7.1% | 7.4% |
| Median | 5.8% | 6.6% |
| Interquartile 25% (IQ1) | 5.0% | 5.9% |
| Interquartile 75% (IQ3) | 7.4% | 7.8% |
| Interquartile Range (IQR) | 2.4% | 1.9% |
| Standard Deviation (Sample) | 4.4% | 4.3% |
| Standard Deviation (Population) | 4.4% | 4.3% |
Similar Demographics by Ambulatory Disability
Demographics Similar to Immigrants from Greece by Ambulatory Disability
In terms of ambulatory disability, the demographic groups most similar to Immigrants from Greece are Pakistani (6.0%, a difference of 0.0%), Immigrants from Moldova (6.0%, a difference of 0.010%), Macedonian (6.0%, a difference of 0.030%), Romanian (6.0%, a difference of 0.040%), and Immigrants from Philippines (6.0%, a difference of 0.050%).
| Demographics | Rating | Rank | Ambulatory Disability |
| Immigrants | Zaire | 83.6 /100 | #139 | Excellent 6.0% |
| Czechs | 83.3 /100 | #140 | Excellent 6.0% |
| Swedes | 83.1 /100 | #141 | Excellent 6.0% |
| Immigrants | Philippines | 83.0 /100 | #142 | Excellent 6.0% |
| Romanians | 82.9 /100 | #143 | Excellent 6.0% |
| Macedonians | 82.8 /100 | #144 | Excellent 6.0% |
| Pakistanis | 82.5 /100 | #145 | Excellent 6.0% |
| Immigrants | Greece | 82.5 /100 | #146 | Excellent 6.0% |
| Immigrants | Moldova | 82.4 /100 | #147 | Excellent 6.0% |
| Immigrants | Eastern Europe | 82.0 /100 | #148 | Excellent 6.0% |
| Lithuanians | 81.9 /100 | #149 | Excellent 6.0% |
| Maltese | 81.6 /100 | #150 | Excellent 6.0% |
| Greeks | 79.6 /100 | #151 | Good 6.0% |
| Immigrants | Austria | 78.8 /100 | #152 | Good 6.0% |
| Syrians | 75.5 /100 | #153 | Good 6.0% |
Demographics Similar to Bahamians by Ambulatory Disability
In terms of ambulatory disability, the demographic groups most similar to Bahamians are Nepalese (6.6%, a difference of 0.060%), Guyanese (6.6%, a difference of 0.12%), Trinidadian and Tobagonian (6.6%, a difference of 0.25%), Spanish (6.6%, a difference of 0.26%), and Hmong (6.6%, a difference of 0.46%).
| Demographics | Rating | Rank | Ambulatory Disability |
| Spanish American Indians | 0.5 /100 | #258 | Tragic 6.5% |
| Aleuts | 0.4 /100 | #259 | Tragic 6.6% |
| Immigrants | Belize | 0.4 /100 | #260 | Tragic 6.6% |
| Irish | 0.4 /100 | #261 | Tragic 6.6% |
| English | 0.4 /100 | #262 | Tragic 6.6% |
| Hmong | 0.3 /100 | #263 | Tragic 6.6% |
| Nepalese | 0.2 /100 | #264 | Tragic 6.6% |
| Bahamians | 0.2 /100 | #265 | Tragic 6.6% |
| Guyanese | 0.2 /100 | #266 | Tragic 6.6% |
| Trinidadians and Tobagonians | 0.2 /100 | #267 | Tragic 6.6% |
| Spanish | 0.2 /100 | #268 | Tragic 6.6% |
| French | 0.1 /100 | #269 | Tragic 6.6% |
| Slovaks | 0.1 /100 | #270 | Tragic 6.7% |
| Immigrants | Trinidad and Tobago | 0.1 /100 | #271 | Tragic 6.7% |
| French Canadians | 0.1 /100 | #272 | Tragic 6.7% |