Cheyenne vs Immigrants from Croatia Ambulatory Disability
COMPARE
Cheyenne
Immigrants from Croatia
Ambulatory Disability
Ambulatory Disability Comparison
Cheyenne
Immigrants from Croatia
6.9%
AMBULATORY DISABILITY
0.0/ 100
METRIC RATING
292nd/ 347
METRIC RANK
6.0%
AMBULATORY DISABILITY
75.1/ 100
METRIC RATING
154th/ 347
METRIC RANK
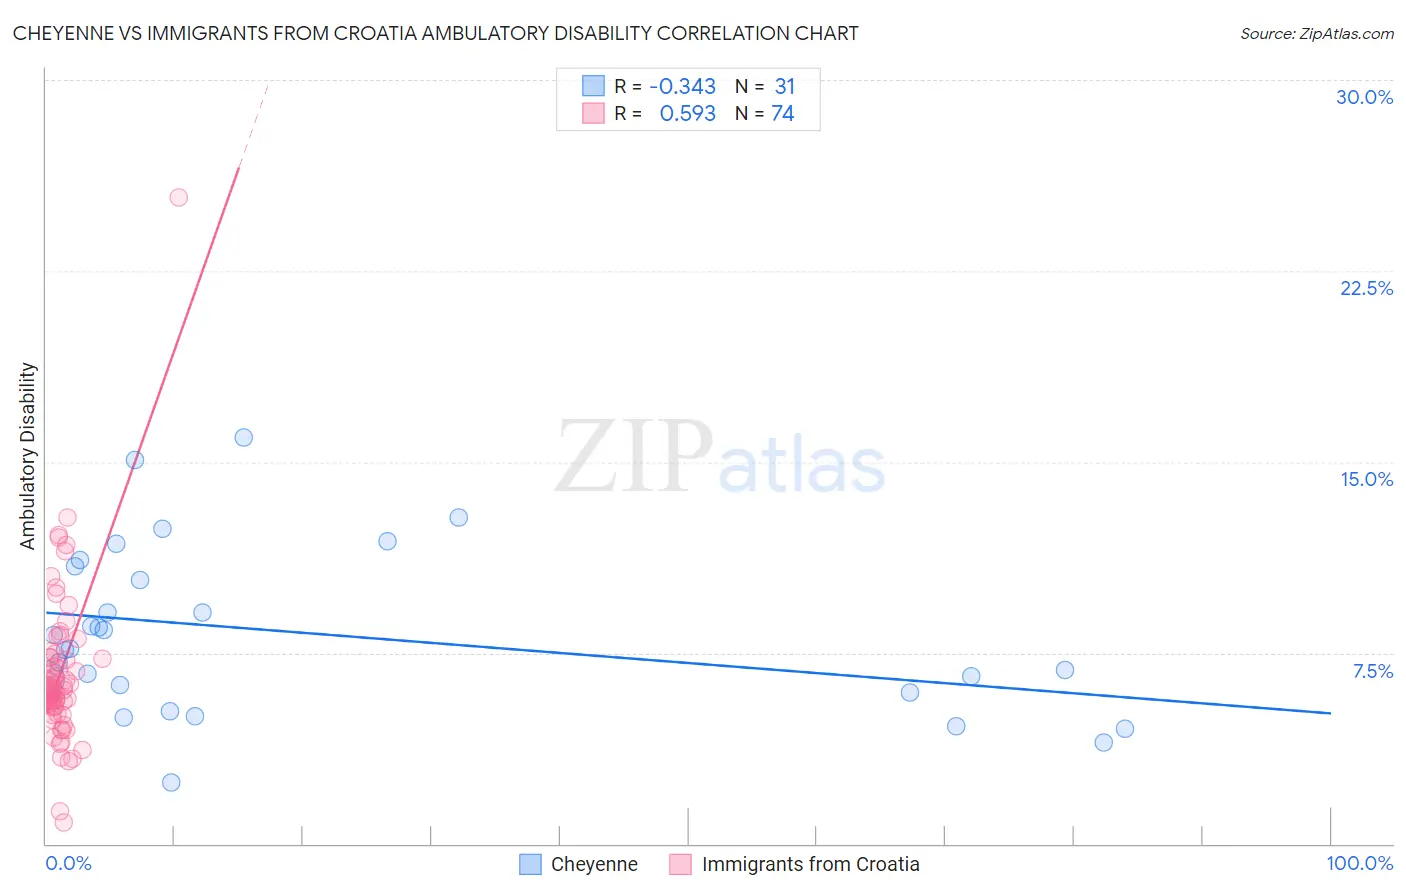
Cheyenne vs Immigrants from Croatia Ambulatory Disability Correlation Chart
The statistical analysis conducted on geographies consisting of 80,709,712 people shows a mild negative correlation between the proportion of Cheyenne and percentage of population with ambulatory disability in the United States with a correlation coefficient (R) of -0.343 and weighted average of 6.9%. Similarly, the statistical analysis conducted on geographies consisting of 132,566,129 people shows a substantial positive correlation between the proportion of Immigrants from Croatia and percentage of population with ambulatory disability in the United States with a correlation coefficient (R) of 0.593 and weighted average of 6.0%, a difference of 14.0%.
Ambulatory Disability Correlation Summary
| Measurement | Cheyenne | Immigrants from Croatia |
| Minimum | 2.4% | 0.85% |
| Maximum | 16.0% | 25.4% |
| Range | 13.6% | 24.5% |
| Mean | 8.3% | 6.7% |
| Median | 7.7% | 6.1% |
| Interquartile 25% (IQ1) | 6.0% | 5.4% |
| Interquartile 75% (IQ3) | 10.9% | 7.3% |
| Interquartile Range (IQR) | 4.9% | 1.9% |
| Standard Deviation (Sample) | 3.3% | 3.2% |
| Standard Deviation (Population) | 3.2% | 3.1% |
Similar Demographics by Ambulatory Disability
Demographics Similar to Cheyenne by Ambulatory Disability
In terms of ambulatory disability, the demographic groups most similar to Cheyenne are West Indian (6.9%, a difference of 0.060%), Scotch-Irish (6.9%, a difference of 0.16%), Immigrants from Dominica (6.9%, a difference of 0.19%), Immigrants from St. Vincent and the Grenadines (6.9%, a difference of 0.24%), and Nonimmigrants (6.9%, a difference of 0.33%).
| Demographics | Rating | Rank | Ambulatory Disability |
| Fijians | 0.0 /100 | #285 | Tragic 6.8% |
| Yakama | 0.0 /100 | #286 | Tragic 6.8% |
| U.S. Virgin Islanders | 0.0 /100 | #287 | Tragic 6.8% |
| Immigrants | Nonimmigrants | 0.0 /100 | #288 | Tragic 6.9% |
| Immigrants | Dominica | 0.0 /100 | #289 | Tragic 6.9% |
| Scotch-Irish | 0.0 /100 | #290 | Tragic 6.9% |
| West Indians | 0.0 /100 | #291 | Tragic 6.9% |
| Cheyenne | 0.0 /100 | #292 | Tragic 6.9% |
| Immigrants | St. Vincent and the Grenadines | 0.0 /100 | #293 | Tragic 6.9% |
| Cape Verdeans | 0.0 /100 | #294 | Tragic 6.9% |
| Crow | 0.0 /100 | #295 | Tragic 6.9% |
| Alaskan Athabascans | 0.0 /100 | #296 | Tragic 6.9% |
| French American Indians | 0.0 /100 | #297 | Tragic 6.9% |
| Immigrants | Grenada | 0.0 /100 | #298 | Tragic 6.9% |
| Puget Sound Salish | 0.0 /100 | #299 | Tragic 6.9% |
Demographics Similar to Immigrants from Croatia by Ambulatory Disability
In terms of ambulatory disability, the demographic groups most similar to Immigrants from Croatia are Syrian (6.0%, a difference of 0.030%), Immigrants from Scotland (6.0%, a difference of 0.21%), Northern European (6.0%, a difference of 0.23%), Ghanaian (6.0%, a difference of 0.26%), and Immigrants from Fiji (6.0%, a difference of 0.27%).
| Demographics | Rating | Rank | Ambulatory Disability |
| Immigrants | Moldova | 82.4 /100 | #147 | Excellent 6.0% |
| Immigrants | Eastern Europe | 82.0 /100 | #148 | Excellent 6.0% |
| Lithuanians | 81.9 /100 | #149 | Excellent 6.0% |
| Maltese | 81.6 /100 | #150 | Excellent 6.0% |
| Greeks | 79.6 /100 | #151 | Good 6.0% |
| Immigrants | Austria | 78.8 /100 | #152 | Good 6.0% |
| Syrians | 75.5 /100 | #153 | Good 6.0% |
| Immigrants | Croatia | 75.1 /100 | #154 | Good 6.0% |
| Immigrants | Scotland | 72.1 /100 | #155 | Good 6.0% |
| Northern Europeans | 71.8 /100 | #156 | Good 6.0% |
| Ghanaians | 71.3 /100 | #157 | Good 6.0% |
| Immigrants | Fiji | 71.2 /100 | #158 | Good 6.0% |
| Immigrants | Latvia | 71.1 /100 | #159 | Good 6.0% |
| Central Americans | 69.8 /100 | #160 | Good 6.0% |
| Immigrants | Belarus | 69.2 /100 | #161 | Good 6.1% |